Category:Surface plots
Jump to navigation
Jump to search
Some files, not yet on Commons, can be found here: w:en:User:Sam Derbyshire/Gallery
Subcategories
This category has the following 7 subcategories, out of 7 total.
3
A
- Animations of surface plots (233 F)
M
- Monkey saddle (11 F)
S
- Surface plots of atan2 (4 F)
📚
- Surface plots (orange SVG) (11 F)
Media in category "Surface plots"
The following 200 files are in this category, out of 722 total.
(previous page) (next page)-

-

-

-

-
 -y-(x^2+y^2+1) plot; BPST instanton.png 451 × 382; 81 KB
-
 1-Fitzhugh Nagumo plot 10.jpg 400 × 400; 43 KB
-
 1-Fitzhugh Nagumo plot 11.jpg 400 × 400; 41 KB
-
 1-Fitzhugh Nagumo plot 3.jpg 400 × 400; 48 KB
-
 1-Fitzhugh Nagumo plot 4.jpg 400 × 400; 49 KB
-
 1-Fitzhugh Nagumo plot 5.jpg 400 × 400; 48 KB
-
 1-Fitzhugh Nagumo plot 6.jpg 400 × 400; 44 KB
-
 1-Fitzhugh Nagumo plot 7.jpg 400 × 400; 54 KB
-
 1-Fitzhugh Nagumo plot 8.jpg 400 × 400; 48 KB
-
 1-Fitzhugh Nagumo plot 9.jpg 400 × 400; 50 KB
-

-
 2-D Rectangular window.jpg 560 × 420; 32 KB
-
 2D Wavefunction (1,1) Surface Plot.png 1,575 × 1,181; 433 KB
-
 2D Wavefunction (1,2) Surface Plot.png 1,575 × 1,181; 490 KB
-
 2D Wavefunction (2,1) Surface Plot.png 1,575 × 1,181; 548 KB
-
 2D Wavefunction (2,2) Surface Plot.png 1,575 × 1,181; 605 KB
-
 2JCCH hydroxymethyl.jpg 2,772 × 4,419; 2.72 MB
-
 3-D mesh plot.jpg 560 × 420; 41 KB
-
 3-D meshgrid plot.jpg 560 × 420; 42 KB
-
 3-D surface plot.jpg 560 × 420; 31 KB
-
 3d graph x2+xy+y2.png 573 × 404; 99 KB
-
 3D graph.png 636 × 499; 38 KB
-
 3D Hyperbolastic Graph of Phytoplankton Biomass.png 402 × 246; 59 KB
-
 3D Plot.png 640 × 384; 102 KB
-
 3d Quadratic.png 800 × 600; 20 KB
-
 3D tRR-eps-converted-to.jpg 1,730 × 1,225; 159 KB
-
 3D-plot.png 355 × 318; 19 KB
-
 3D1.PNG 727 × 478; 64 KB
-
 3D5.PNG 726 × 477; 73 KB
-
 3D7.PNG 727 × 476; 131 KB
-
 3dFunctionMuPAD.png 378 × 378; 97 KB
-
 3dplot1.png 300 × 239; 13 KB
-
 3DsurfaceB-sm.png 417 × 258; 65 KB
-

-
-

-
 5x5elemsTeam5.png 1,280 × 908; 42 KB
-
-
 A typical 3d plot produced using JavaGnuplotHybrid.png 599 × 325; 46 KB
-
 Abs x to y.png 1,200 × 930; 166 KB
-
 Ackley's function (2).PNG 720 × 700; 70 KB
-
 Ackley's function.pdf 1,200 × 900; 1.76 MB
-
 Affens-triang.png 2,185 × 1,472; 221 KB
-
 Affensattel.png 1,024 × 768; 530 KB
-
 Airflow-Obstructed-Duct.png 1,270 × 907; 85 KB
-
 Aizerman2d 1.png 1,328 × 1,448; 248 KB
-
 Algorithmic snail.jpg 604 × 600; 43 KB
-
 Ambiguity function square pulse.png 1,200 × 901; 54 KB
-
 Anger function 3d.png 400 × 400; 110 KB
-
 Anti-Helmholtz-coil-field-3D.png 2,808 × 2,320; 907 KB
-
 Anticipo d'accensione 3D.png 729 × 560; 18 KB
-
 ANUGA mesh.png 1,152 × 864; 1.96 MB
-
 As wiki lgm parab.png 560 × 420; 38 KB
-
 As wiki lgm parab.svg 512 × 414; 726 KB
-
 Associated LegendreQ3D1.png 400 × 400; 76 KB
-
 Asymmetricwave2.png 1,814 × 1,358; 505 KB
-
 Atan diagram.svg 575 × 449; 204 KB
-
 Atan2(y,x).png 728 × 583; 153 KB
-
 AtanDiagram.png 880 × 768; 123 KB
-
 Atbildes virsma.jpg 478 × 470; 59 KB
-
 B2 optimization function.png 800 × 600; 37 KB
-
 B2 optimization function.svg 800 × 600; 1.26 MB
-
 Beale's function.pdf 1,200 × 900; 1.15 MB
-
 Beta distribution log geometric variances back view - J. Rodal.png 960 × 720; 334 KB
-
 Beta distribution log geometric variances front view - J. Rodal.png 960 × 720; 381 KB
-
 Beta function on real plane.png 479 × 378; 39 KB
-
 Beta-Funktion real-Ebene.png 479 × 378; 17 KB
-
 BetaDistrCDF1.svg 720 × 540; 3.56 MB
-
 BetaDistrCDF2.svg 720 × 540; 1.82 MB
-
 BetaDistrMean.svg 720 × 540; 1.85 MB
-
 BetaDistrMeanMedianDiff.svg 720 × 540; 1.29 MB
-
 BetaDistrMedian.svg 720 × 540; 2.14 MB
-
 BetaDistrMedianApprDiff.svg 720 × 540; 1.2 MB
-
 BetaDistrMedianApprMeanMode.svg 720 × 540; 1.22 MB
-
 BetaDistrMode.svg 720 × 540; 1.2 MB
-
 BetaFuncDemo.svg 720 × 540; 1.45 MB
-
 Bild Aufgabe 2.1a.gif 1,200 × 900; 1.46 MB
-
 Bimodal-bivariate-small.png 403 × 298; 115 KB
-
 Binom3d.jpg 740 × 510; 154 KB
-
 Biv gumbel dist.png 800 × 400; 109 KB
-
 Booth's function.pdf 1,200 × 900; 7.15 MB
-
 Boussinesq soliton Maple 3D plot.png 612 × 541; 155 KB
-
 Breather surface.PNG 1,076 × 612; 246 KB
-
 Brownian surface.png 752 × 492; 40 KB
-
 Bukin function 6.pdf 1,200 × 900; 943 KB
-
 Bump2D illustration.png 1,604 × 986; 179 KB
-
 Burgers Fisher PDE 3d Maple plot.png 400 × 400; 66 KB
-
 Bvn-small.png 109 × 58; 25 KB
-
 Caixa 2D.png 640 × 480; 82 KB
-
 Calculul unui volum 98eujhdfn.png 431 × 330; 120 KB
-
 Cartesian1.jpeg 1,201 × 901; 336 KB
-
 Cartographie d'allumage.jpg 746 × 683; 69 KB
-
 Cauchy2 density.png 1,009 × 499; 42 KB
-
 CDF for symmetric Beta distribution vs. x and alpha=beta - J. Rodal.jpg 1,599 × 1,056; 185 KB
-
 Cdf.png 572 × 457; 271 KB
-
 Ch4 surface color.png 650 × 493; 322 KB
-
 Chi(x) Re complex 3D plot.png 400 × 400; 63 KB
-
 Circular Paraboloid Quadric.png 750 × 829; 249 KB
-
 Circular Paraboloid.png 450 × 390; 60 KB
-
 Clip image002.gif 273 × 226; 23 KB
-
 Closed Surface.svg 375 × 249; 9 KB
-
 Cobb–Douglas Function.svg 600 × 480; 111 KB
-
 Colour Map Axis Explanation.png 3,751 × 1,559; 1.47 MB
-
 ColRev3a40.tif 1,272 × 784; 447 KB
-
 Complex arcsin abs 01 Pengo.svg 720 × 540; 864 KB
-
 Complex Function Z Squared Plot.png 560 × 420; 27 KB
-
 Complex weighted example.png 227 × 238; 43 KB
-
 Cono parabólico.jpg 621 × 430; 225 KB
-
 Conoid.jpg 288 × 304; 29 KB
-
 ConstrTestFunc01.png 820 × 665; 45 KB
-
 ConstrTestFunc02.png 705 × 700; 59 KB
-
 ConstrTestFunc03.png 1,200 × 1,355; 130 KB
-
 ConstrTestFunc04.png 775 × 700; 54 KB
-
 Continuous Functions – Non-continuous 2d-example (view 1).svg 512 × 512; 594 KB
-
 Continuous Functions – Non-continuous 2d-example (view 2).svg 512 × 512; 597 KB
-
 Continuous Functions – Non-continuous 2d-example (view 3).svg 512 × 512; 593 KB
-
 Continuous in x and y but non continuous.png 1,228 × 941; 114 KB
-
 Contour3D.jpg 795 × 666; 242 KB
-
 ContoursA.gif 200 × 227; 13 KB
-
 Contrainte resistance 3d eloigne.svg 503 × 367; 477 KB
-
 Contrainte resistance 3d proche.svg 503 × 367; 482 KB
-
 Cpmcv.png 387 × 327; 19 KB
-
 Cross-in-tray function.pdf 1,200 × 900; 2.27 MB
-
 Crosshatch 3D plot showing nodes.PNG 850 × 670; 58 KB
-
 Crosshatch 3D plot with projected level curves.PNG 850 × 670; 59 KB
-
 Cubic surface.jpg 400 × 400; 38 KB
-
 CumulativeGaussianq-distribution.jpg 1,280 × 696; 141 KB
-
 CumulativeGaussianq-distribution2.jpg 1,280 × 696; 167 KB
-
 Current-loop-field-3D.png 2,600 × 1,680; 473 KB
-
 Curva sobre una superficie.svg 910 × 910; 4.97 MB
-
 Curvature of BPST Instanton.png 459 × 382; 54 KB
-
 Cylinder Function Transform.svg 450 × 350; 80 KB
-
 Datest Surfaceplot.JPG 500 × 500; 33 KB
-
 Daubechies20LowPassHighPass2DFilter.png 420 × 414; 23 KB
-
 Daubechies20LowPassHighPass2DFilterM.png 800 × 583; 129 KB
-
 DE Meta-Fitness Landscape (12 benchmark problems).JPG 1,054 × 694; 145 KB
-
 DE Meta-Fitness Landscape (Sphere and Rosenbrock).JPG 1,050 × 698; 158 KB
-
 Degasperis-Procesi equation plot.png 400 × 400; 81 KB
-
 Denoise - gaussian matrix.svg 600 × 480; 98 KB
-
 Densite2D.jpg 1,201 × 900; 110 KB
-
 Deriv direcc-1.png 340 × 226; 25 KB
-
 Deriv direcc-2.png 340 × 226; 30 KB
-
 Deriv direcc-4.png 340 × 226; 31 KB
-
 Diagram9.svg 552 × 303; 3.58 MB
-

-

-

-
 Differentialgleichung t=0.5.png 560 × 420; 32 KB
-
 Differentialgleichung t=0.png 560 × 420; 29 KB
-
 Differentialgleichung t=1.5.png 560 × 420; 31 KB
-
 Differentialgleichung t=1.png 560 × 420; 30 KB
-
 Differentialgleichung t=2.png 560 × 420; 31 KB
-
 Diffusion Bild 2.png 560 × 420; 32 KB
-
 Diffusion example results.jpg 658 × 612; 96 KB
-
 Diffusivitaet FA versus RA.jpg 400 × 300; 30 KB
-
 Diffusivitaet Fraktionale Anisotropie.jpg 400 × 300; 33 KB
-
 Diffusivitaet Relative Anisotropie.jpg 400 × 300; 32 KB
-
 Diffusivitaet VV.jpg 400 × 300; 32 KB
-
 Dini Surface.png 4,893 × 2,469; 1.24 MB
-
 Dini's Surface.svg 512 × 275; 210 KB
-
 Dini.png 1,024 × 768; 1.2 MB
-
 Dipole pattern.gif 590 × 334; 75 KB
-
 Dipole-potential-3D-isolines-far-away.png 1,500 × 1,077; 148 KB
-
 Dipole-potential-3D-values.png 1,500 × 1,073; 469 KB
-
 Dirichleit Probability Distribution for Different Alpha.png 862 × 799; 246 KB
-
 Dirichlet distributions.png 885 × 763; 191 KB
-
 Discriminant49CubicFieldFundamentalDomainOfUnits.png 839 × 491; 38 KB
-
 Division of x pow 2 times y pow 2 by x the sum of pow 4 and y pow 2 towards 0.png 1,325 × 1,117; 331 KB
-
 DL Surface Plot.jpg 1,462 × 1,090; 283 KB
-
 Double Integral.png 485 × 327; 75 KB
-
 Drehparaboloid-Schiebefl.png 1,344 × 1,024; 513 KB
-
 DUDS.jpg 234 × 234; 16 KB
-
 EasyPlot z grid2.PNG 853 × 853; 98 KB
-
 Edge wave elevation.png 1,200 × 900; 50 KB
-
 Eggholder function.pdf 1,200 × 900; 2.45 MB
-
 EinsteinSum-graph-contour.png 720 × 360; 10 KB
-
 Electric potential.pdf 1,058 × 787; 36 KB
-
 Electric potential.png 1,000 × 700; 27 KB
-
 Electric-field-terrain-model-3D.stl 5,120 × 2,880; 630 KB
-
 Elliptic Paraboloid Colored.png 648 × 396; 67 KB
-
 Elliptic paraboloid.png 400 × 440; 55 KB
-
 Entcatcol w.gif 521 × 325; 70 KB
-
 Equidistant D2RDx0 ex.png 952 × 649; 150 KB
-
 Equidistant d2x0.png 712 × 510; 179 KB
-

-
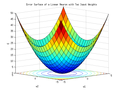 Error surface of a linear neuron with two input weights.png 560 × 420; 19 KB
-
 Estar transition function.png 815 × 571; 32 KB
-
 Example of simple fishnet plot using PLplot.png 767 × 495; 91 KB
-
 Example solution.png 619 × 458; 13 KB
-

-
-

-
 Extrema3.gif 520 × 422; 23 KB
-
 Extrema6.gif 467 × 379; 18 KB
-
 EXTXIE.jpg 535 × 360; 59 KB
-
 F(x,y)=−((cosx)^2 + (cosy)^2)^2.PNG 1,000 × 705; 68 KB
_Parameter_estimates_vs._excess_Kurtosis_and_(squared)_Skewness_Beta_distribution_-_J._Rodal.png)
_for_Beta_Distribution_versus_alpha_and_beta_from_0_to_2_-_J._Rodal.jpg)
_for_Beta_distribution_versus_alpha_and_beta_from_0_to_2_-_J._Rodal.jpg)
_plot;_BPST_instanton.png)


_Surface_Plot.png)
_Surface_Plot.png)
_Surface_Plot.png)
_Surface_Plot.png)


.PNG)


.png)


_Re_complex_3D_plot.png)


.svg)
.svg)
.svg)


.JPG)
.JPG)


%3D%E2%88%92((cosx)%5E2_%2B_(cosy)%5E2)%5E2.PNG)
_for_Beta_distribution_versus_alpha_and_beta_from_0_to_2_-_J._Rodal.jpg)