Category:Statistical methods
Jump to navigation
Jump to search
type of data analysis method | |||||
| Upload media | |||||
| Subclass of |
| ||||
|---|---|---|---|---|---|
| Part of |
| ||||
| Facet of |
| ||||
| Different from | |||||
| |||||
Subcategories
This category has the following 4 subcategories, out of 4 total.
A
D
S
V
Media in category "Statistical methods"
The following 24 files are in this category, out of 24 total.
-
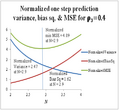
Figure 1 One step prediction MSE.png 490 × 449; 17 KB
-
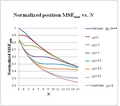
Figure 2 Minimum Position MSE vs. N.png 520 × 461; 17 KB
-
Figure 2 Minimum positions MSE.png 520 × 461; 20 KB
-
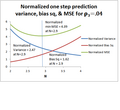
Figure 3 Position variances and MSE.png 490 × 449; 15 KB
-
Figure 4 Optimal FOE position RMSE.png 490 × 449; 12 KB
-
Figure 5 Comparison of mu2 vs f 3,opt.png 490 × 449; 14 KB
-
Figure 6 Predictor IMMA & Opt FOE MSE comparison.png 490 × 449; 15 KB
-
Figure 7 Normalized predictor comparison.png 490 × 449; 14 KB
-
Formula probabilità.jpg 604 × 430; 42 KB
-
Juri-yang.png 466 × 466; 22 KB
-
Kth-pair-greater-than.svg 673 × 673; 29 KB
-
Kth-pair-less-than.svg 673 × 673; 29 KB
-
Kth-pair-middle-of-middle.svg 638 × 673; 29 KB
-
Kth-pair-row-medians-aligned.svg 531 × 673; 12 KB
-
Kth-pair-row-medians-compared.svg 531 × 673; 13 KB
-
Kth-pair-row-medians.svg 673 × 673; 29 KB
-
One step prediction MSE.png 490 × 449; 16 KB
-
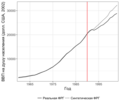
SCMGermany.png 529 × 457; 31 KB
-
Sequence analysis basic concepts.jpg 1,245 × 563; 69 KB
-
Singular spectrum analysis grouped reconstruction.svg 485 × 346; 58 KB
-
Statistical Inference.pdf 1,239 × 1,752, 158 pages; 34.43 MB
-
Storey-Tibshirani procedure.png 342 × 291; 20 KB

