Category:Spanish-language pie charts
Jump to navigation
Jump to search
Media in category "Spanish-language pie charts"
The following 61 files are in this category, out of 61 total.
-
AccionesIcaria.png 593 × 425; 32 KB
-
Aldealengua rosana.jpg 392 × 254; 15 KB
-
Alv-graphic-totalpopulationbysex.png 676 × 458; 12 KB
-
ARRETRANCOHOMBRESYMUJERES2013.jpg 710 × 402; 104 KB
-
Cara moneda.jpg 696 × 573; 119 KB
-
Composició química de la Ketamina.png 1,360 × 824; 134 KB
-
Crecimiento por Ciudad.PNG 785 × 385; 74 KB
-
DESCENSOARRETRANCO2013.jpg 482 × 289; 89 KB
-
Distribucion empuje sts des.png 560 × 400; 41 KB
-
Distribucion masa sts des.png 560 × 400; 22 KB
-
Distribució percentual dels elements que componen la Ketamina.png 892 × 613; 108 KB
-
Distribución energética española.JPG 639 × 421; 37 KB
-
Distribution of ethnic groups in Crimea 2001-es.svg 564 × 619; 133 KB
-
Ejemplo-demografia.svg 1,136 × 1,259; 7 KB
-
EleccionesGeneralesEspanya2011 participacion.png 776 × 506; 87 KB
-
Emigracion en CA.png 277 × 152; 15 KB
-
Encuesta Española.jpg 483 × 291; 25 KB
-
Encuesta Sol Portugal.jpg 482 × 290; 25 KB
-
Escolaridad Uriangato y sus porcentajes.JPG 1,329 × 550; 106 KB
-
Esquema lixiviados.jpg 779 × 249; 32 KB
-
Estadisticas recortadas.JPG 613 × 234; 18 KB
-
Estadisticas1.jpg 608 × 330; 52 KB
-
GGL.PNG 1,002 × 668; 35 KB
-
Grafic1.JPG 480 × 280; 12 KB
-
Grafic2.JPG 440 × 309; 13 KB
-
Grafica gloria aldeacipreste.xcf 491 × 294; 34 KB
-
Grafico AM y DP.jpg 971 × 295; 48 KB
-
Gráfico zonas idóneas jabalí Cabañeros.jpg 528 × 342; 24 KB
-
I.comu.val.png 1,100 × 757; 29 KB
-
Inmigración En México 2010.png 1,052 × 784; 78 KB
-
Japan general election, 2005 es.png 1,200 × 1,402; 182 KB
-
LenguasRomancesEnPorcentajes.png 697 × 549; 25 KB
-
Lineas moviles febrero 2011.jpg 960 × 720; 34 KB
-
Léxico del español.png 961 × 721; 32 KB
-
Mecanismo de clonacion.jpg 590 × 344; 28 KB
-
META ARRETRANCO2013.jpg 482 × 290; 100 KB
-
OrganizacionesFeagas.jpg 400 × 218; 37 KB
-
Paquete accionario YPF.png 939 × 638; 90 KB
-
PARCIALESARRETRANCO2013.jpg 482 × 289; 91 KB
-
Participación de mercado de las farmacias chilenas, 2007.svg 500 × 600; 202 KB
-
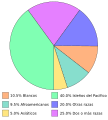
Población por lenguas.png 294 × 240; 4 KB
-
Porcentaje.JPG 565 × 299; 18 KB
-
Relación entre evangelios sinópticos.svg 900 × 1,160; 7 KB
-
Rodentia etc.png 758 × 641; 127 KB
-
Rosco Residuos.jpg 572 × 335; 20 KB
-
Rosco ResiduosZ.jpg 572 × 335; 70 KB
-
Sabf.jpg 513 × 215; 12 KB
-
Shropshireligionminorias.jpg 478 × 360; 24 KB
-
Shropshireminorias.jpg 484 × 276; 15 KB
-
Sources of stratospheric chlorine.es.png 1,024 × 963; 186 KB
-
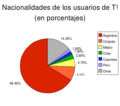
Taringadotnetnacionalidades.png 516 × 455; 25 KB
-
Trabajadores.jpg 962 × 293; 39 KB
-
Uso de disolventes por sectores.pdf 1,239 × 1,754; 28 KB
-
Uso de disolventes.png 648 × 394; 19 KB
-
Uso Industrial de disolventes.png 845 × 457; 33 KB
-
Validez de la votación sobre Coalición Pro Acceso.png 481 × 289; 28 KB
-
Ventas1989TaylorSwift.svg 512 × 724; 53 KB
-
Vo5.png 1,002 × 669; 27 KB
-
World energy consumption by type 2006 es.png 763 × 277; 96 KB
-
Wykres-consumo.jpg 302 × 218; 9 KB


