Category:Soil science diagrams
Jump to navigation
Jump to search
Subcategories
This category has the following 9 subcategories, out of 9 total.
B
- Block diagrams of soils (13 F)
C
M
- Mohr's circle (95 F)
P
- Paleosol diagrams (4 F)
Q
- QFL diagrams (6 F)
R
- Roscoe Surface (6 F)
S
- Soil forming factors (10 F)
T
- Soil texture triangle (45 F)
Media in category "Soil science diagrams"
The following 200 files are in this category, out of 227 total.
(previous page) (next page)-
USTaxonomykey.tif 3,057 × 4,369; 1.27 MB
-
02265suciedad4.jpg 544 × 580; 22 KB
-
Adsorbimento fosfati.svg 600 × 340; 42 KB
-
Agriculture Production System.gif 312 × 421; 49 KB
-
Annual report of the Nebraska State Horticultural Society (18432749571).jpg 1,562 × 2,584; 441 KB
-
Assorbimento e pH del suolo.svg 600 × 600; 41 KB
-
Barley sampla.png 623 × 465; 14 KB
-
Basic soil types diagram.svg 951 × 629; 870 KB
-
Becker Co Pie Chart 2-20-18 Wiki Version.pdf 1,650 × 1,275; 6 KB
-
Berseem egypt.png 423 × 236; 6 KB
-
Biodiversite sol occupation.png 403 × 343; 9 KB
-
Blue Earth County Pie Chart New Wiki Version.pdf 1,650 × 1,275; 24 KB
-
Bodenprofil Normgley ohne Sd.svg 331 × 645; 130 KB
-
Bodenprofil Normgley.svg 331 × 734; 216 KB
-
Bodenwasser.png 300 × 200; 5 KB
-
Bodenwasser2.png 1,058 × 794; 49 KB
-
Brud i jord.png 786 × 417; 34 KB
-
Brunjord.PNG 690 × 557; 14 KB
-
Bulletin of the U.S. Department of Agriculture (1913-1923.) (20473784806).jpg 1,726 × 2,886; 1.46 MB
-
BöschungGrundbruch.svg 512 × 327; 41 KB
-
Calcímetro de Bernard.jpg 713 × 671; 79 KB
-
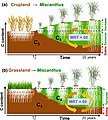
Carbon storage under Miscanthus x giganteus plantations.jpg 1,851 × 2,063; 1.03 MB
-
Carrot and ECe Scurve.png 623 × 465; 18 KB
-
Carrot and ECe tolerance.png 623 × 465; 13 KB
-
Catena of soils.jpg 960 × 720; 40 KB
-
CEC concept.pdf 2,658 × 1,125; 44 KB
-
CEC concept.svg 1,700 × 720; 162 KB
-
CEC measurement principle.pdf 4,050 × 1,500; 182 KB
-
CEC measurement principle.svg 1,700 × 628; 169 KB
-
CEC pH.pdf 2,658 × 1,125; 42 KB
-
CEC pH.svg 1,700 × 720; 152 KB
-
CEC values plot.svg 666 × 351; 38 KB
-
Chaînes trophiques du sol.png 2,958 × 2,265; 1.69 MB
-
Ciclo dellAzoto.jpg 475 × 370; 41 KB
-
Columns.001.png 800 × 600; 138 KB
-
Complexe argilo-humique.svg 366 × 384; 47 KB
-
Components of Soil Pie Chart.png 1,080 × 1,278; 96 KB
-
Composició ideal d'un sòl franc.png 1,410 × 1,819; 195 KB
-
Constituants du sol.png 802 × 521; 157 KB
-
Cotton egypt.png 423 × 236; 5 KB
-
Cotton pakistan segreg.png 623 × 465; 16 KB
-
Cotton pakistan.png 623 × 465; 14 KB
-
CrResponse.JPG 683 × 596; 49 KB
-
Dane County WI Pie Chart.pdf 1,650 × 1,275; 6 KB
-
DART Measurements Profile.svg 1,052 × 744; 785 KB
-
Densidad aparente del suelo.png 274 × 242; 18 KB
-
Desert pavement evolution.png 3,150 × 1,115; 3.35 MB
-
DrainTable.jpg 662 × 434; 49 KB
-
Dynamics soil organic matter-it.svg 280 × 200; 9 KB
-
Dépenses sols pollués en pourcent du PIB AEE.jpg 988 × 852; 147 KB
-
Edaphon Verteilung.png 767 × 489; 43 KB
-
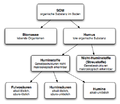
Einteilung der organischen Substanz im Boden.png 494 × 429; 43 KB
-
Element.png 100 × 100; 2 KB
-
Erscheinungsformen des unterirdischen Wassers.svg 550 × 450; 84 KB
-
Estructura-suelo.jpg 513 × 541; 66 KB
-
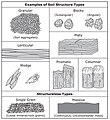
Examples of Soil Structure Types.jpg 683 × 745; 131 KB
-
ExchangeESP.JPG 609 × 320; 18 KB
-
Fig soilmap types.png 2,147 × 1,388; 50 KB
-
Formación del suelo.png 1,472 × 544; 77 KB
-
Formation humus.jpg 4,061 × 3,583; 2.18 MB
-
GarmsarDWT.png 662 × 515; 25 KB
-
Generalized Soil Profile.png 219 × 712; 42 KB
-
GleitflächenneigungCullmann.svg 512 × 416; 15 KB
-
GOHANA2.jpg 640 × 480; 53 KB
-
GR000083.jpg 284 × 240; 19 KB
-
GR000084.jpg 198 × 154; 12 KB
-
GR000085.jpg 124 × 222; 7 KB
-
GR000086.jpg 168 × 61; 9 KB
-
GR000087.jpg 176 × 64; 8 KB
-
GR000088 (1).jpg 236 × 218; 8 KB
-
GR000089.jpg 130 × 98; 4 KB
-
GR000090.jpg 140 × 64; 4 KB
-
GR000091.jpg 140 × 102; 4 KB
-
Graph of Impervious Surfaces Coverage in the US.png 1,200 × 742; 72 KB
-
Graph showing soil respiration increasing with temperature.jpg 772 × 474; 77 KB
-
Grundbruch.svg 300 × 120; 23 KB
-
GrundbruchBerechnung.svg 512 × 263; 1 KB
-
Haies erosion.png 444 × 483; 217 KB
-
Half-logarithm graph.jpg 1,183 × 829; 311 KB
-
Hennepin Co Pie Chart No Text Version.pdf 1,650 × 1,275; 6 KB
-
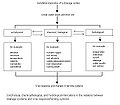
Hierarchical path analysis of interdependencies of soil properties.jpg 1,673 × 1,792; 733 KB
-
HydrCondTable.GIF 944 × 562; 23 KB
-
Hygroscopic water.png 718 × 339; 141 KB
-
Jefferson County WI Pie Chart.pdf 1,650 × 1,275; 115 KB
-
Klasifikacija tla.png 800 × 800; 181 KB
-
Kohaerent.png 100 × 100; 2 KB
-
Kruemel.png 100 × 100; 4 KB
-
Krzywe buforowe.svg 760 × 414; 52 KB
-
Landpeople s cc8-es.png 288 × 191; 11 KB
-
Landpeople s cc8.PNG 288 × 191; 11 KB
-
Laterite-saprolite cross section.PNG 443 × 474; 79 KB
-
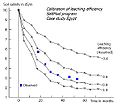
Leachingeff.jpg 632 × 501; 32 KB
-
Lizymetr.svg 639 × 500; 18 KB
-
Maas-Hoffman model inverted.png 451 × 281; 5 KB
-
Maize egypt.png 423 × 236; 6 KB
-
Map Pedology II 1989 - Lower Mantua plain - Touring Club Italiano CART-TEM-026 (cropped).jpg 1,133 × 1,506; 1.81 MB
-
Map Pedology II 1989 - Touring Club Italiano CART-TEM-026.jpg 5,000 × 3,348; 11.56 MB
-
Max higroscopic water.png 718 × 339; 192 KB
-
Microbiote du sol.gif 1,058 × 794; 137 KB
-
Modes de liaison entre argile et humus.png 1,275 × 877; 801 KB
-
Morphology Of Sand Blows.jpg 1,144 × 731; 62 KB
-
Mustard sampla and ECe tolerance.png 623 × 465; 16 KB
-
Mécanismes pedogenèse.jpg 426 × 682; 74 KB
-
Nitrosp.png 720 × 625; 74 KB
-
Non steady state probe tp08 hukseflux.gif 155 × 800; 7 KB
-
Obrázek 1.JPG 750 × 541; 72 KB
-
Obrázek 2.JPG 583 × 802; 125 KB
-
Ontstaan ijzeroerbank.PNG 1,091 × 638; 39 KB
-
Organismes du sol.png 4,264 × 3,503; 7.9 MB
-
PF-curve klei.jpg 2,133 × 2,149; 285 KB
-
PF-curve zand.jpg 2,041 × 2,047; 258 KB
-
PF-curve.jpg 1,178 × 1,314; 115 KB
-
PIA16572-MarsCuriosityRover-RoverSoils-20121203.jpg 1,408 × 1,056; 108 KB
-
Podsol.PNG 690 × 557; 14 KB
-
Podsoltyper2.jpg 626 × 354; 30 KB
-
Podzol-diagram.jpg 226 × 543; 17 KB
-
Polluants UE 2002 fR.jpg 950 × 559; 96 KB
-
Pollution sols UE causes.jpg 2,584 × 1,828; 494 KB
-
Polní půdní záznam KPP.jpg 1,428 × 3,500; 1.12 MB
-
Polyeder.png 100 × 100; 2 KB
-
Proceedings of the American Society of Agronomy (1911) (14584997397).jpg 3,152 × 1,880; 976 KB
-
Processo de formação do organossolo.png 2,144 × 800; 416 KB
-
Průvodní zpráva KPP.jpg 1,500 × 1,060; 443 KB
-
PSM V48 D685 Average alkali salts by composition at the tulare agricultural station.png 2,509 × 1,754; 395 KB
-
Raspored cestica u tlu.png 736 × 197; 25 KB
-
Relieve fracturado.png 598 × 179; 2 KB
-
Rhizodeposition.png 1,280 × 720; 424 KB
-
Rice egypt (cropped).png 398 × 220; 4 KB
-
Rice egypt.png 423 × 236; 6 KB
-
Ritenzione idrica.jpg 400 × 300; 53 KB
-
Rolette Co ND Pie Chart No Text 3-7-17 Version.pdf 1,650 × 1,275; 97 KB
-
Réserve utile en eau d'un sol.png 1,106 × 827; 344 KB
-
Salinity from irrigation.png 878 × 276; 13 KB
-
Salinity from irrigation.svg 800 × 251; 27 KB
-
Salinization4.gif 733 × 454; 8 KB
-
Saltleaching.jpg 422 × 318; 21 KB
-
SALTMOD4.JPG 577 × 513; 37 KB
-
Sargent Co ND Pie Chart No Text 3-7-17 Version.pdf 1,650 × 1,275; 92 KB
-
Schgrfso.png 410 × 778; 444 KB
-
Sedimentation-légendé.jpg 850 × 430; 43 KB
-
Soil biogeochemical cycles and biota underpin ecosystem services.png 1,195 × 906; 401 KB
-
Soil Biology poster (7894542354).jpg 6,300 × 2,250; 3.2 MB
-
Soil Biomantle with Artifacts.svg 674 × 213; 66 KB
-
Soil biomantle.svg 612 × 216; 56 KB
-
Soil CDEGS.png 1,122 × 626; 733 KB
-
Soil class and field chart.svg 1,048 × 502; 64 KB
-
Soil degradation venn diagram.png 1,024 × 983; 438 KB
-
Soil food webUSDA.jpg 800 × 717; 463 KB
-
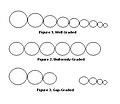
Soil Gradations.JPG 375 × 326; 16 KB
-
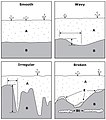
Soil Horizon Boundary Topography Diagram.jpg 532 × 604; 49 KB
-
Soil organic carbon cycling.png 5,100 × 6,211; 1.25 MB
-
Soil pH effect on nutrient availability.svg 512 × 448; 1.32 MB
-
Soil phases.svg 561 × 351; 110 KB
-
Soil Salinization Color.png 5,370 × 3,642; 1.8 MB
-
Soil Salinization Grayscale.png 5,321 × 3,619; 1.79 MB
-
Soil structure.jpg 480 × 400; 41 KB
-
Soil Textural Triangle.jpg 674 × 703; 108 KB
-
Soil texture chart.png 1,808 × 2,244; 83 KB
-
Soil Texture Flow Chart of the 4th edition of the WRB.png 720 × 960; 236 KB
-
Soil thermal conductivity measurement system.png 287 × 725; 16 KB
-
Soil-pH.svg 512 × 362; 92 KB
-
SoilLeaching2.jpg 616 × 491; 21 KB
-
Soilprofile1.jpg 290 × 408; 18 KB
-
SoilsDépensesExpenditure enBig.jpg 1,996 × 1,451; 260 KB
-
SoilsExpenditureFRhauteDef.jpg 1,996 × 1,521; 272 KB
-
SoilWater 01.png 299 × 291; 13 KB
-
Sols hydromorphie ordre vallée.jpg 489 × 646; 88 KB
-
Sols perte relativeUE20 EEAEen1.jpg 1,265 × 610; 130 KB
-
Sols perte UE AAE Français modifié-1.jpg 1,265 × 610; 135 KB
-
Sols perte UE20 AAE.jpg 1,265 × 610; 116 KB
-
Sols pollués dépensesFrP.jpg 985 × 750; 127 KB
-
Sols pollués UEPollutedSoilsEU2006.jpg 752 × 621; 105 KB
-
SolsAgricolesPerte relativeUE20 EEA Fr.jpg 1,265 × 610; 124 KB
-
Sorghum pakistan.png 623 × 465; 14 KB
-
Standardized sampling protocol SPUN.png 898 × 878; 66 KB
-
Stock carbone en france (estimation).jpg 896 × 860; 136 KB
-
Struktura - glina i prah.png 789 × 301; 100 KB
-
Struktura BPEJ (Bonitovaná půdně ekologická jednotka).png 631 × 355; 36 KB
-
Struktura tla.png 800 × 600; 102 KB
-
Struktury gleby.jpg 452 × 530; 53 KB
-
Sugarcane S-curve.png 623 × 465; 16 KB
-
SWScan00022 копия.png 700 × 1,102; 199 KB
-
Tabla 1 Textura del suelo.PNG 677 × 720; 28 KB
-
Tabulka 1.JPG 987 × 553; 60 KB
-
Tabulka 2.JPG 746 × 223; 24 KB
-
Tabulka zrnitosti.jpg 839 × 583; 40 KB
-
TemperaturaSuolo.JPG 762 × 490; 42 KB
-
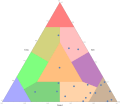
Ternary triangle plot of soil types sand clay and silt.svg 1,411 × 1,253; 55 KB
-
Test de sédimentation.svg 744 × 1,052; 117 KB
-
Texture by Feel.jpg 1,537 × 2,101; 449 KB

