Category:Sex differences in human life expectancy
Jump to navigation
Jump to search
Media in category "Sex differences in human life expectancy"
The following 46 files are in this category, out of 46 total.
-
20200101 Life expectancy increases with age already achieved - chart.svg 1,000 × 750; 9 KB
-
20200101 Remaining life expectancy - US.svg 1,000 × 750; 9 KB
-
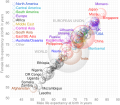
Comparison gender life expectancy CIA factbook.svg 512 × 448; 127 KB
-
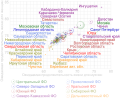
Comparison of life expectancy in Russian subjects by sex -ru.svg 512 × 426; 69 KB
-
Comparison of life expectancy in Russian subjects by sex.svg 512 × 446; 56 KB
-
Comparison of male and female life expectancy -Africa -ru.svg 512 × 407; 36 KB
-
Comparison of male and female life expectancy -Africa.svg 512 × 407; 33 KB
-
Comparison of male and female life expectancy -America -ru.svg 512 × 407; 24 KB
-
Comparison of male and female life expectancy -America.svg 512 × 407; 23 KB
-
Comparison of male and female life expectancy -Asia -ru.svg 512 × 407; 39 KB
-
Comparison of male and female life expectancy -Asia.svg 512 × 407; 36 KB
-
Comparison of male and female life expectancy -Europe -ru.svg 512 × 407; 31 KB
-
Comparison of male and female life expectancy -Europe.svg 512 × 407; 29 KB
-
Comparison of male and female life expectancy -world -ru.svg 512 × 407; 92 KB
-
Comparison of male and female life expectancy -world.svg 512 × 407; 85 KB
-
Difference between male and female life expectancy, OWID.svg 850 × 600; 8 KB
-
Female and male life expectancy at birth (in years), OWID.svg 850 × 600; 18 KB
-
Female-to-male life expectancy ratio, OWID.svg 850 × 600; 23 KB
-
Healthy life expectancy bar chart -Africa -sex -ru.png 1,724 × 588; 81 KB
-
Healthy life expectancy bar chart -Africa -sex.png 1,724 × 587; 73 KB
-
Healthy life expectancy bar chart -America -sex -ru.png 1,333 × 592; 73 KB
-
Healthy life expectancy bar chart -America -sex.png 1,333 × 576; 62 KB
-
Healthy life expectancy bar chart -Asia -sex -ru.png 1,724 × 604; 84 KB
-
Healthy life expectancy bar chart -Asia -sex.png 1,724 × 593; 74 KB
-
Healthy life expectancy bar chart -Asia and Oceania -sex -ru.png 1,724 × 604; 88 KB
-
Healthy life expectancy bar chart -Asia and Oceania -sex.png 1,724 × 593; 77 KB
-
Healthy life expectancy bar chart -CIS -sex -ru.png 887 × 620; 49 KB
-
Healthy life expectancy bar chart -CIS -sex.png 747 × 593; 39 KB
-
Healthy life expectancy bar chart -Europe -sex -ru.png 1,724 × 593; 80 KB
-
Healthy life expectancy bar chart -Europe -sex.png 1,724 × 586; 73 KB
-
Healthy life expectancy bar chart -European Union -sex -ru.png 1,249 × 592; 62 KB
-
Healthy life expectancy bar chart -European Union -sex.png 1,249 × 585; 55 KB
-
Healthy life expectancy bar chart -Latin America -sex -ru.png 943 × 608; 59 KB
-
Healthy life expectancy bar chart -Latin America -sex.png 943 × 576; 49 KB
-
Healthy life expectancy bar chart -WHO regions -sex -ru.png 887 × 627; 47 KB
-
Healthy life expectancy bar chart -WHO regions -sex.png 887 × 601; 36 KB
-
Healthy life expectancy bar chart -world -sex -ru.png 1,724 × 584; 81 KB
-
Healthy life expectancy bar chart -world -sex.png 1,724 × 587; 71 KB
-
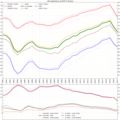
Life expectancy in Russia (by Rosstat) -v3 -diff -ru.png 1,081 × 1,081; 241 KB
-
Life expectancy in Russia (by Rosstat) -v3 -diff.png 1,081 × 1,081; 231 KB
-
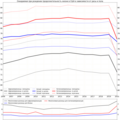
Life expectancy in USA by race -sex gap -ru.png 1,153 × 1,153; 155 KB
-
Life expectancy in USA by race -sex gap.png 1,081 × 1,081; 131 KB
-
Life expectancy of women vs life expectancy of men, OWID.svg 850 × 600; 39 KB
-
LifeExpectancyBetweenFemaleAndMales.jpg 1,027 × 519; 83 KB


