Category:Seismological diagrams
Jump to navigation
Jump to search
Subcategories
This category has the following 5 subcategories, out of 5 total.
+
- Seismograms (186 F)
F
- Focal mechanism diagrams (11 F)
Media in category "Seismological diagrams"
The following 152 files are in this category, out of 152 total.
-
1998 PNG Earthquake Computer Model.png 522 × 345; 27 KB
-
2d Seismic Acquisition Source & Reciever.jpg 412 × 513; 36 KB
-
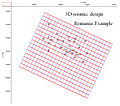
3D Seismic Design.jpg 763 × 675; 213 KB
-
Airgun-array hg.png 2,306 × 1,616; 844 KB
-
Amplification sismique SH dans une couche schema.gif 448 × 338; 7 KB
-
Amplitude Log.jpg 720 × 540; 40 KB
-
Asperity model - 4categories.png 1,800 × 1,600; 63 KB
-
Asperity.jpg 180 × 74; 6 KB
-
BeamLocal.png 2,020 × 520; 10 KB
-
Common Depth Point (CDP).jpg 967 × 361; 54 KB
-
Common Depth Point Source & Reciever.jpg 976 × 720; 119 KB
-
Comparison of Various Seismic Stacking Methods.png 677 × 821; 475 KB
-
Corrected wigb.png 1,366 × 768; 160 KB
-
Data after NMO correction with NMO velocity 1500 m per s.png 805 × 1,071; 1.83 MB
-
Data reading from seismic plotter.jpg 1,702 × 1,738; 4.51 MB
-
Depth vs time.jpg 1,204 × 859; 139 KB
-
Determining epicenter.png 2,231 × 1,522; 220 KB
-
Dispersion curve.png 750 × 581; 21 KB
-
Dispersive body wave kkfig1.png 489 × 216; 6 KB
-
Displacements locglob.png 2,764 × 953; 11 KB
-
DPRK's Nuclear tests recorded in Mudanjiang, China.svg 581 × 530; 189 KB
-
Earthquake cycle.png 754 × 355; 72 KB
-
Earthquake Richter Scale.jpg 705 × 524; 162 KB
-
Earthquake wave paths uk.svg 300 × 250; 24 KB
-
Earthquake wave paths.de.svg 300 × 250; 25 KB
-
EarthquakeMagnitude.GIF 240 × 440; 11 KB
-
ECDM 20231113 Iceland volcanic.pdf 1,625 × 1,125; 457 KB
-
Elastic rebound.jpg 338 × 473; 58 KB
-
Elastic Rebound.svg 744 × 1,052; 15 KB
-
ElasticRebound Thum.png 504 × 647; 5 KB
-
Epicenter location.png 1,280 × 720; 111 KB
-
Epicenter.svg 512 × 397; 22 KB
-
Explosion d'Oppau enregistrée à Strasbourg.jpg 1,398 × 1,019; 591 KB
-
Fault embedded in heterogenous environment.JPG 644 × 644; 156 KB
-
Fig 5 sísmica digital.jpg 720 × 540; 141 KB
-
Fig 8 sísmica digital.jpg 720 × 540; 157 KB
-
Flat Spot in Seismic.jpg 1,004 × 693; 215 KB
-
Focal mechanism.svg 1,400 × 750; 68 KB
-
Forces locglob.png 2,764 × 953; 12 KB
-
Frequency composition.png 921 × 1,057; 117 KB
-
Fresenl Zon Seismic.png 355 × 264; 18 KB
-
Glacier quake abundance Greenland 1993-2013 columns.svg 1,362 × 350; 109 KB
-
Graphic representation of the ESI 2007 intensity degrees.tif 4,811 × 2,065; 2.5 MB
-
GraphicalMigration.jpg 960 × 720; 118 KB
-
Great Neapolitan Earthquake of 1857 Vol 2 fig279.jpg 444 × 354; 29 KB
-
Great Neapolitan Earthquake of 1857 Vol 2 fig282.jpg 452 × 762; 57 KB
-
Great Neapolitan Earthquake of 1857 Vol 2 Fig320.jpg 382 × 337; 18 KB
-
How EQL form.gif 440 × 218; 29 KB
-
Illustration4 related to earthquake.jpg 677 × 444; 42 KB
-
Illustration9 related to earthquake.jpg 641 × 366; 17 KB
-
Illustrations related to earthquake.jpg 2,144 × 1,506; 879 KB
-
Impedance Logs Inverted From Amplitude.jpg 720 × 540; 58 KB
-
Impedance Well Log.jpg 720 × 540; 39 KB
-
Impedans20.png 937 × 640; 32 KB
-
Inverse Q filtering kkigraf1.png 1,054 × 310; 12 KB
-
Inverse Q filtering kkigraf2.png 1,041 × 303; 12 KB
-
Inversefilter Kkigraf1b.png 1,069 × 299; 13 KB
-
Kgraf1.png 490 × 216; 5 KB
-
Kgraf2.png 500 × 216; 5 KB
-
Kolskydispersion1.png 1,441 × 790; 9 KB
-
Kuril Benioff zone.JPG 425 × 305; 17 KB
-
Linear Seismic Inversion Flow Chart.jpg 720 × 540; 41 KB
-
LocalModes.png 1,989 × 517; 7 KB
-
Love wave fr.svg 1,154 × 744; 132 KB
-
Love wave in Chinese.png 2,000 × 1,464; 466 KB
-
Love wave.jpg 678 × 364; 59 KB
-
Love wave.svg 1,154 × 744; 132 KB
-
Multiple.png 598 × 267; 10 KB
-
NMO Correction.png 1,066 × 700; 52 KB
-
Normal move-out.png 1,228 × 540; 75 KB
-
Oblique slip fault.jpg 737 × 448; 27 KB
-
Oblique slip fault.PNG 678 × 424; 174 KB
-
Oblique slip fault.svg 3,485 × 2,206; 108 KB
-
OBS schema.jpg 230 × 192; 8 KB
-
Ondas sísmicas s p.svg 250 × 200; 9 KB
-
Over Corrected Data with NMO Velocity 200 Meter Per Second.png 811 × 1,066; 1.73 MB
-
P sismic wave.jpg 694 × 164; 18 KB
-
Path of Earthquakes through the Outer and Anisotropic West Inner Core.pdf 1,275 × 1,650; 129 KB
-
Path of Earthquakes through the Outer and Anisotropic West Inner Core.svg 816 × 1,056; 1.28 MB
-
Pds mul.png 439 × 322; 8 KB
-
PGA Kocaeli.jpg 718 × 260; 45 KB
-
Plate boundaries.png 1,134 × 700; 69 KB
-
Prem.png 1,324 × 1,967; 131 KB
-
Principe-sismique-reflexion.png 454 × 298; 34 KB
-
ProjectionForFaultPlaneSolution.svg 458 × 458; 6 KB
-
PSM V02 D541 Continuous wave single shock.jpg 578 × 521; 20 KB
-
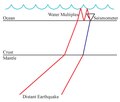
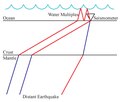
PsSPconversions withwatermultiples forwiki.pdf 1,275 × 1,085; 319 KB
-
PsSPconversions withwatermultiples.pdf 1,275 × 1,085; 323 KB
-
PsSPconversions withwatermultiplesforwiki.pdf 1,275 × 1,085; 317 KB
-
Qfilter3.png 1,015 × 751; 25 KB
-
Qfilter4.png 617 × 184; 4 KB
-
Qfilter5.png 625 × 95; 18 KB
-
Qfilter6.png 637 × 95; 12 KB
-
Qfilter7.png 625 × 195; 10 KB
-
Qfilter8.png 625 × 175; 25 KB
-
Qfilterimage1.jpg 537 × 419; 42 KB
-
Qfilterimage1.png 560 × 420; 14 KB
-
Qfilterimage2.png 560 × 420; 14 KB
-
Raw Data Without NMO Correction.png 804 × 1,071; 1.77 MB
-
Rayleigh wave direction.jpg 568 × 352; 34 KB
-
Raypaths for a Dipping Reflector.png 1,070 × 470; 37 KB
-
Raypaths for a Horizontal Reflector.png 862 × 364; 16 KB
-
Refraccion ondas P - (Refraction of P-wave in Spanish).png 553 × 482; 87 KB
-
Refracted-wave-svg.svg 680 × 540; 17 KB
-
Refraction of P-wave.PNG 553 × 482; 67 KB
-
RichterFreqEnergyGraph-en.svg 637 × 401; 83 KB
-
Rimbalzo elastico.jpg 504 × 647; 32 KB
-
Sadə qeydedici cihaz.png 618 × 408; 59 KB
-
Scholtz 1973 simple.png 720 × 720; 45 KB
-
SEGD 3.0 Vert.PNG 623 × 1,073; 63 KB
-
SEGY file byte stream structure.svg 733 × 101; 15 KB
-
Seismic dim spot.png 521 × 144; 6 KB
-
Seismic fault model 1 ja.png 600 × 1,200; 40 KB
-
Seismic fault model 1 nolang.png 800 × 1,500; 126 KB
-
Seismic Fault.jpg 551 × 306; 101 KB
-
Seismic Hardware.png 609 × 447; 41 KB
-
Seismic polarity reversal.png 519 × 144; 6 KB
-
Seismic profile.png 1,862 × 500; 1,018 KB
-
Seismic Ray Fresnel Zone.png 725 × 265; 29 KB
-
Seismic wave travel through Earth.png 1,496 × 915; 750 KB
-
Seysmik tədqiqat.png 640 × 630; 284 KB
-
Simple diagram illustrating the effect of seismic stacking.png 397 × 383; 11 KB
-
Subarray.jpg 683 × 534; 39 KB
-
Subduction boundary and asperity.png 1,150 × 800; 38 KB
-
Surface wave motion.png 1,280 × 1,013; 45 KB
-
Surface wave penetration.png 1,381 × 850; 35 KB
-
SV wave propagation X.gif 800 × 520; 5.51 MB
-
SV wave propagation y.gif 716 × 463; 20.82 MB
-
SV wave propagation.gif 716 × 463; 20.07 MB
-
Sísmica de alta.GIF 940 × 876; 107 KB
-
Taramòt.png 332 × 217; 124 KB
-
The propagation of SV wave in a homogeneous half-space.gif 800 × 520; 13.32 MB
-
Time-distance curve.png 1,106 × 1,378; 713 KB
-
Trace6.png 625 × 202; 26 KB
-
Types of earthquakes en.png 800 × 400; 25 KB
-
Types of earthquakes ja.png 800 × 400; 29 KB
-
Types of noise on a seismic record.png 868 × 554; 15 KB
-
Umbria-Marche 1997 Earthquake plot.jpg 1,280 × 582; 266 KB
-
Under-corrected data with NMO velocity of 5000 meters per second.png 835 × 1,099; 1.84 MB
-
Wadati-Benioff zone he.jpg 915 × 657; 73 KB
-
Wadati-Benioff zone.jpg 757 × 530; 49 KB
-
WATS.png 1,580 × 914; 71 KB
-
Wave group and microbarom.png 1,559 × 527; 292 KB
-
Wavepath of PKP(BC) and PKP(DF).jpg 2,188 × 2,192; 850 KB
-
Zenermodel attenuation.png 692 × 420; 7 KB
-
Классификация.JPG 977 × 671; 141 KB
-
Сейсмозащита на шаровых опорах.JPG 1,072 × 764; 151 KB
-
דוגמה לעקומה יחסית מצטברת.jpg 3,829 × 2,602; 4.56 MB
-
室津港の南海地震時の隆起量を基にした予測モデル.png 1,208 × 1,000; 50 KB


