Category:Seismic maps
Jump to navigation
Jump to search
English: Maps showing seismic areas
Italiano: Mappe di zonazione sismica.
Subcategories
This category has the following 3 subcategories, out of 3 total.
- Seismic maps of Asia (5 F)
Media in category "Seismic maps"
The following 133 files are in this category, out of 133 total.
-
Global gt3.gif 731 × 554; 23 KB
-
010324152800 2001年03月24日 15時27分頃 震源:安芸灘 (北緯 34.12度、東経 132.71度).jpg 1,280 × 1,280; 304 KB
-
1927 map.jpg 289 × 408; 37 KB
-
Aardbevingen.png 897 × 626; 116 KB
-
Alaska earthquakes.jpg 976 × 620; 162 KB
-
Armenia seismo.png 1,437 × 1,393; 115 KB
-
Ausseis.jpg 556 × 449; 87 KB
-
Bangladesh earthquake zones.jpg 1,092 × 1,512; 193 KB
-
Bulgaria Seismic Hazard Map.svg 1,642 × 1,036; 303 KB
-
California Department of Conservation - Earthquake Shaking Potential for California.jpg 5,000 × 7,400; 3.56 MB
-
California Department of Conservation – Earthquake Shaking Potential for California.jpg 1,705 × 2,144; 951 KB
-
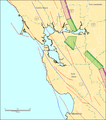
California fault parameters sfbay1.png 561 × 635; 35 KB
-
Carte de risque séismiques de la Suisse.png 3,507 × 2,480; 2.6 MB
-
Carte réseau Geoscope 2017.png 1,328 × 799; 1.46 MB
-
Cascadia subduction zone USGS He.jpg 378 × 552; 40 KB
-
Cascadia subduction zone USGS.png 495 × 706; 23 KB
-
CAVE at INL's CAES 002.jpg 4,256 × 2,832; 9.55 MB
-
Ceinture de feu du Pacifique.svg 943 × 570; 298 KB
-
Chief regions of earthquakes in Caucasia (Élisée Reclus).JPG 415 × 350; 36 KB
-
Determining epicenter.png 2,231 × 1,522; 220 KB
-
Doucier.JPG 1,600 × 1,200; 513 KB
-
Dushanbe seismic map.png 1,128 × 779; 1.27 MB
-
Earthquake areas.jpg 2,328 × 1,514; 1.82 MB
-
Earthquake distribution 1998.png 574 × 436; 118 KB
-
Earthquake distribution 1999.png 573 × 435; 102 KB
-
Earthquake distribution 2000.png 573 × 435; 102 KB
-
Earthquake distribution 2001.png 574 × 436; 119 KB
-
Earthquake distribution 2002.png 574 × 436; 118 KB
-
Earthquake distribution 2003.png 574 × 436; 118 KB
-
Earthquake distribution 2004.png 574 × 436; 118 KB
-
Earthquake distribution 2005.png 574 × 436; 119 KB
-
Earthquake distribution 2006.png 574 × 435; 118 KB
-
Earthquake distribution 2007.png 574 × 435; 117 KB
-
Earthquake distribution 2008.png 574 × 435; 117 KB
-
Earthquake distribution 2009.png 574 × 435; 118 KB
-
Earthquake distribution 2010.gif 574 × 435; 113 KB
-
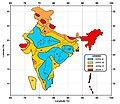
Earthquake hazard zoning map of India.gif 556 × 606; 32 KB
-
Earthquake info by Ja Cabinet office01.png 1,121 × 1,594; 53 KB
-
EarthquakeRegions1911.jpg 2,137 × 1,087; 1.12 MB
-
Earthquakes in China since 186 BC.png 716 × 480; 39 KB
-
Epicenter2.jpg 350 × 350; 43 KB
-
EQ storm Turkey.png 1,052 × 744; 392 KB
-
Eq-prob.jpg 535 × 716; 150 KB
-
EQs 1900-2013 worldseis.png 1,817 × 969; 2.67 MB
-
EQs 1900-2015 china.png 840 × 917; 1.56 MB
-
EQs 1900-2015 uswest.png 1,000 × 1,044; 1.9 MB
-
EQs 1900-2016 aleutian tsum.png 1,021 × 578; 994 KB
-
EQs 1900-2016 caribbean tsum.png 1,019 × 655; 1.29 MB
-
EQs 1900-2016 eastafrica tsum.png 684 × 947; 1.13 MB
-
EQs 1900-2016 emaustralia tsum.png 764 × 1,009; 1.62 MB
-
EQs 1900-2016 himalaya tsum.png 994 × 645; 1.14 MB
-
EQs 1900-2016 kuril tsum.png 889 × 992; 1.82 MB
-
EQs 1900-2016 mediterranean tsum.png 1,011 × 669; 1.21 MB
-
EQs 1900-2016 mexico tsum.png 1,015 × 635; 1.13 MB
-
EQs 1900-2016 middleeast tsum.png 1,004 × 665; 1.17 MB
-
EQs 1900-2016 newguinea tsum.png 1,016 × 657; 1.43 MB
-
EQs 1900-2016 philippinesea tsum.png 926 × 1,040; 2.14 MB
-
EQs 1900-2016 qcf tsum.png 819 × 1,027; 1.53 MB
-
EQs 1900-2016 southamerica tsum.png 793 × 1,021; 1.64 MB
-
EQs 1900-2016 sumatra tsum.png 732 × 997; 1.33 MB
-
EQs 8 plus since 1900.png 1,858 × 1,125; 542 KB
-
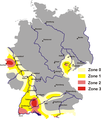
Erdbebenzonen.png 1,902 × 2,248; 144 KB
-
Escenetor.jpg 1,069 × 518; 124 KB
-
European seismic zones ESA367817.png 956 × 576; 543 KB
-
GSHAP Peak Ground Acceleration and Seismic Zoning map of Eritrea.jpg 4,953 × 3,509; 1.66 MB
-
Hawaii 1998 0p2s 2p50.png 730 × 570; 51 KB
-
Hazardmap.png 3,600 × 1,800; 657 KB
-
Hydrate ridge.jpg 400 × 313; 52 KB
-
Juan de fuca plate.png 536 × 652; 46 KB
-
Juan-de-fuca-plate.PNG 536 × 652; 46 KB
-
Kuril Seismicity Depth Map.JPG 523 × 554; 57 KB
-
Kuril-Kamchatka Trench USGS.png 911 × 1,063; 1.06 MB
-
MajorEarthquakes1900.jpg 3,485 × 2,273; 1.08 MB
-
Mapa de Amenaza Sísmica de Colombia.png 2,000 × 2,290; 4.7 MB
-
Mapa de peligrosidad sísmica de España.svg 1,184 × 1,016; 836 KB
-
Mapa Terremoto Valparaíso 1906.JPG 782 × 1,212; 198 KB
-
Nankai-Tonankai-Tokai earthquake history.png 500 × 1,660; 442 KB
-
National-Map 0.jpg 2,250 × 1,500; 947 KB
-
Neic ptad w - Magnitude 4.9 - BEIJING-HEBEI BORDER REGION, CHINA.jpg 517 × 557; 55 KB
-
New Madrid and Wabash seizmic zones-USGS mod.png 748 × 819; 430 KB
-
New Madrid and Wabash seizmic zones-USGS.png 748 × 819; 467 KB
-
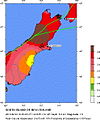
New Zealand earthquake density map.gif 479 × 484; 33 KB
-
Oklahoma seismicity map.pdf 1,650 × 1,275; 2.02 MB
-
Oklahoma seismicity map.svg 990 × 720; 9.21 MB
-
Pacific ULVZs.jpeg 1,024 × 768; 68 KB
-
Peligrosidad sísmica en México.jpg 800 × 528; 130 KB
-
PetroTel3.jpg 339 × 250; 79 KB
-
Plate tectonics map.gif 3,380 × 2,285; 2.63 MB
-
PSM V86 D452 Areas of earth affected by seismic disturbances.jpg 2,639 × 1,601; 282 KB
-
Quake epicenters 1963-98 notitle.png 800 × 420; 78 KB
-
Quake epicenters 1963-98.png 800 × 500; 80 KB
-
Risć Sìśmic in Emìglia Rumàgna.png 441 × 238; 37 KB
-
RuptureAreasNankaiMegathrust 2013.png 1,336 × 774; 408 KB
-
RuptureAreasNankaiMegathrust.png 2,103 × 1,439; 373 KB
-
Seir.png 3,509 × 2,480; 5.67 MB
-
Seismic Hazard Zones in the United States..pdf 1,650 × 1,275; 460 KB
-
Seismic Hazard Zones In The United States.pdf 1,650 × 1,275; 455 KB
-
Seismic microzonation of Dushanbe.png 559 × 711; 569 KB
-
Seismic Risk Levels- Eastern Hemisphere.jpg 772 × 481; 155 KB
-
Seismic Risk Levels-Western hemisphere.jpg 824 × 937; 157 KB
-
Seismic zones.jpg 542 × 470; 36 KB
-
Seismic-Map-of-India.png 483 × 512; 192 KB
-
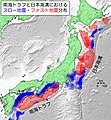
SeismicAreas JapanTrenchEarthquakes (ko).svg 1,182 × 1,536; 163 KB
-
SeismicAreas JapanTrenchEarthquakes for wikipedia thai.png 1,000 × 1,300; 175 KB
-
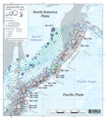
SeismicAreas JapanTrenchEarthquakes.png 1,000 × 1,300; 210 KB
-
Seismicity in greece 1990 2000.png 421 × 425; 93 KB
-
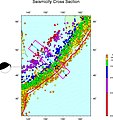
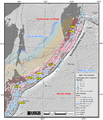
Seismicity of Eastern margin of the Japan Sea 1.jpg 799 × 1,100; 83 KB
-
Seismographic world map 1858.png 960 × 720; 907 KB
-
Sesimic hazard zones of-Pakistan.png 2,366 × 1,891; 736 KB
-
Seysmik zonalar.jpg 942 × 612; 182 KB
-
Sismicidad en el mundo.jpg 1,388 × 1,016; 329 KB
-
Slow and fast earthquakes in the Nankai Trough and Japan Trench.jpg 4,418 × 4,774; 1.46 MB
-
SundaMegathrustSeismicity.PNG 468 × 601; 55 KB
-
Taiwan seismicity.jpg 2,063 × 3,045; 2.92 MB
-
TehranSeismicHazardMap.jpg 518 × 577; 71 KB
-
Texas seismicity map.pdf 1,800 × 1,350; 2.15 MB
-
The map of artificial failures in our country.jpg 376 × 534; 164 KB
-
Turkey seismic hazard.jpg 600 × 600; 322 KB
-
U.S. Seismic Hazard Maps.gif 792 × 612; 93 KB
-
US states with reported cryoseisms.PNG 841 × 580; 19 KB
-
USGS AmSo 0120170002fig1.png 1,000 × 1,348; 1.82 MB
-
USGS AmSo 0120170002fig11a.png 2,033 × 1,382; 1,003 KB
-
World seismicity SK.jpg 928 × 1,693; 209 KB
-
World seismicity.jpg 928 × 1,693; 317 KB
-
Wstrząsy sejsmiczne.jpg 727 × 718; 488 KB
-
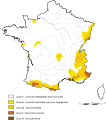
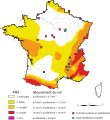
Zonage-sism-tecto-fr.svg 1,028 × 1,055; 436 KB
-
Zonage-sismique-1991-fr.svg 1,028 × 1,168; 511 KB
-
Zonage-sismique-1991-nucl-fr.svg 1,097 × 1,168; 512 KB
-
Zonage-sismique-2011-fr.svg 1,028 × 1,186; 602 KB
-
Zonage-sismique-2011-nucl-fr.svg 1,092 × 1,186; 603 KB
-
מפה איזוסייסמית של רעידת האדמה של 1927 ב-א"י.png 865 × 967; 1.55 MB


