Category:Sedimentology diagrams
Jump to navigation
Jump to search
Subcategories
This category has the following 13 subcategories, out of 13 total.
C
- Clay diagrams (1 F)
D
- Debris flow diagrams (2 F)
- Diagrams of alluvial fans (14 F)
- Diagrams of estuaries (7 F)
- Dune formation diagrams (22 F)
M
- Mudflat diagrams (3 F)
Q
- QFL diagrams (6 F)
S
- Saltation diagrams (4 F)
- Soil texture triangle (45 F)
T
- Turbidite diagrams (7 F)
Media in category "Sedimentology diagrams"
The following 173 files are in this category, out of 173 total.
-
Agglomerate-Ore-Fines.jpg 598 × 198; 112 KB
-
Alluvial fan scheme.PNG 720 × 435; 25 KB
-
Alluvial plain general.PNG 720 × 960; 223 KB
-
Asphalt volcano2 h.jpg 1,554 × 1,192; 951 KB
-
BAB formation.jpg 2,852 × 1,582; 532 KB
-
Backstripping and eustasy correction.jpg 2,639 × 2,810; 1.41 MB
-
Beach and Tidalflat Depositional Environment.jpg 2,736 × 1,824; 1.08 MB
-
Beach high tide sketch map.PNG 960 × 720; 156 KB
-
Beach low tide sketch map.PNG 960 × 720; 123 KB
-
Beach profile.PNG 960 × 480; 29 KB
-
Bed and Laminae Thickness.jpg 331 × 318; 25 KB
-
Bedding descriptors.jpg 5,071 × 3,460; 1.63 MB
-
Bedform Stability Diagram.jpg 4,922 × 3,765; 3.6 MB
-
Bedforms under various flow regimes.pdf 1,183 × 822; 23 KB
-
Bloc diagramme Lias Haut Atlas.jpg 678 × 562; 102 KB
-
Brea Sandstone Deposition.png 483 × 609; 50 KB
-
BrnBld VanVeenGrabSampler.svg 120 × 120; 5 KB
-
Carbon forms and interactions in freshwater ecosystems.jpg 1,808 × 1,058; 112 KB
-
Carbonate platform Tortonian Mallorca 1.PNG 960 × 720; 718 KB
-
Carbonate platform Tortonian Mallorca 2.PNG 720 × 870; 728 KB
-
Carbonate platform Tortonian Mallorca He.jpg 960 × 720; 205 KB
-
CARBONATIC PLATFORM EN.PNG 960 × 250; 14 KB
-
CARBONATIC PLATFORM ES.png 960 × 250; 22 KB
-
CARBONATIC PLATFORM HE.jpg 960 × 250; 93 KB
-
CARBONATIC PLATFORM.PNG 960 × 250; 18 KB
-
Carbonificacion.jpg 549 × 382; 198 KB
-
Chronosomes.svg 842 × 595; 31 KB
-
Clay Mineral Structure.jpg 5,182 × 4,250; 2.74 MB
-
COASTAL TRANSGRESSION-REGRESSION SEQUENCE STRATIGRAPHY.png 1,280 × 720; 116 KB
-
COASTAL TRANSGRESSION-REGRESSION.png 1,280 × 720; 105 KB
-
Compduration.jpg 847 × 512; 33 KB
-
Complex and Coated Grains.jpg 2,886 × 1,955; 2.48 MB
-
Compositional and Textural Maturity.jpg 4,613 × 3,853; 2.28 MB
-
Contmargin-glacial hg.png 1,672 × 1,081; 715 KB
-
Contmargin-interglacial hg.png 1,673 × 1,081; 842 KB
-
Crag and tail.png 1,383 × 600; 32 KB
-
Cross-bed Dune Formation.tif 2,250 × 1,050; 13.62 MB
-
Cross-bedding.gif 224 × 134; 78 KB
-
Crossbedding wikipedia.png 900 × 276; 288 KB
-
Current crescents Huygens Titan comparison Earth.png 933 × 720; 987 KB
-
Curva granulometrica scala normale.jpg 1,019 × 625; 60 KB
-
Curva granulometrica scl normale.jpg 996 × 611; 63 KB
-
Curva granulometrica.jpg 1,196 × 536; 120 KB
-
Cyclic step diagram.jpg 862 × 528; 47 KB
-
Cyclic step formation over time.jpg 1,971 × 904; 363 KB
-
Dataplot hg.jpg 7,524 × 4,831; 5.03 MB
-
Delta peat seams.png 1,280 × 720; 169 KB
-
Delta sezione longitudinale.png 905 × 623; 14 KB
-
Deposition Model.jpg 3,600 × 2,700; 472 KB
-
DEPOSITIONAL SEQUENCE CLASSIC.png 1,280 × 720; 139 KB
-
DEPOSITIONAL SEQUENCE REVIEW.png 1,280 × 720; 149 KB
-
Diagramme-de-hjulstrom.png 728 × 489; 39 KB
-
Dish structure.jpg 2,500 × 3,448; 387 KB
-
Distribution of detritus.png 1,458 × 713; 97 KB
-
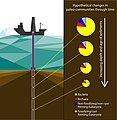
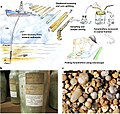
Drilling vessel recovering a sediment core for sedaDNA analysis.jpg 1,431 × 1,472; 465 KB
-
Dunham classification EN.svg 974 × 602; 935 KB
-
Dunham classification NL.svg 974 × 602; 940 KB
-
Dunham Classification.jpg 5,136 × 2,412; 1.54 MB
-
Electron Acceptor Cascade in Marine Sediments.PNG 598 × 372; 71 KB
-
Electron Acceptor Cascade in marine sediments.png 274 × 449; 16 KB
-
Espace d'accommodation.png 1,133 × 492; 52 KB
-
ETH-BIB-Tropfstein-Bildung, schematisch-Dia 247-Z-00424.tif 3,504 × 2,898; 29.15 MB
-
Fan shape diagram.jpg 640 × 480; 58 KB
-
Finitedif.jpg 679 × 720; 39 KB
-
Floodplain and River Depositional Environment.jpg 2,736 × 1,824; 1.14 MB
-
Fluvial current particles transport.png 720 × 540; 8 KB
-
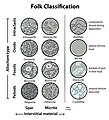
Folk Classification.jpg 3,730 × 4,092; 2 MB
-
Formación de ripples de corriente.svg 674 × 428; 1.23 MB
-
Formación turboglifo (flute cast).jpg 1,887 × 2,230; 318 KB
-
Formation of cross-bedding.jpg 688 × 215; 47 KB
-
Formation of cross-stratification.png 618 × 380; 26 KB
-
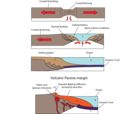
Formation of passive margins (horizontal).png 2,366 × 314; 36 KB
-
Formation of passive margins cropped.svg 574 × 459; 103 KB
-
Formation of passive margins.png 1,202 × 1,144; 74 KB
-
Glacial Depositional Environment.jpg 1,824 × 2,736; 949 KB
-
Gradierte Schichtung EN.jpg 1,364 × 746; 231 KB
-
Gradierte Schichtung He.jpg 1,364 × 746; 201 KB
-
Gradierte Schichtung NL.jpg 1,364 × 746; 233 KB
-
Gradierte Schichtung ReiKi.jpg 1,364 × 746; 153 KB
-
Gravity-corer hg.png 806 × 1,154; 982 KB
-
Grobe Mackensen 1992-Fig3.png 752 × 510; 32 KB
-
Groin model.jpg 935 × 723; 21 KB
-
Groin model2.jpg 935 × 723; 25 KB
-
Growth Evolution 4.jpg 2,114 × 3,495; 2.52 MB
-
Growth strata-01.jpg 2,592 × 1,658; 429 KB
-
Half-graben sedimentation.png 785 × 581; 113 KB
-
Hjulströms diagram en.PNG 744 × 540; 26 KB
-
Hjulströms diagram it.PNG 1,079 × 772; 60 KB
-
Huber Rob et al 2020 Abb 13.png 2,067 × 1,879; 932 KB
-
Hyperpycnal flow buoyant plume.png 1,280 × 720; 249 KB
-
HYPERPYCNAL LOBE MODEL.png 1,280 × 720; 450 KB
-
Inverse grading.gif 1,364 × 746; 332 KB
-
ISLAND WAVE & SEDIMENTARY PATTERNS.png 720 × 720; 143 KB
-
Kaltzeit hg.png 782 × 537; 39 KB
-
Kerghynedhow godhosek.jpg 1,280 × 720; 131 KB
-
Laterite-saprolite cross section.PNG 443 × 474; 79 KB
-
Linked debrite diagram.gif 1,280 × 503; 103 KB
-
Main depositional environments th.svg 1,230 × 777; 548 KB
-
Main depositional environments.svg 1,230 × 777; 603 KB
-
Marine sediment.jpg 1,585 × 1,173; 888 KB
-
Marl vs clay & lime EN.PNG 960 × 720; 42 KB
-
Marl vs clay & lime.PNG 820 × 720; 35 KB
-
Methodological approaches in modern and ancient marine genomics.jpg 1,360 × 1,035; 244 KB
-
Monterey Cyclic Steps Profile View.png 1,499 × 429; 70 KB
-
Morphology Of Sand Blows.jpg 1,144 × 731; 62 KB
-
Mudrock Colors.jpg 2,047 × 1,775; 1.33 MB
-
Mudsandgravel.svg 1,000 × 775; 122 KB
-
My own hjulstrum.gif 331 × 273; 17 KB
-
Nutrient flux.png 628 × 914; 52 KB
-
Packing of spheres.jpg 1,984 × 2,756; 3.19 MB
-
Paleoproxies hg.png 2,425 × 1,409; 147 KB
-
PEAT&COAL IN FLUVIAL ENV(MEANDER).png 1,280 × 720; 293 KB
-
Perillo2013 Bedforms Phase Diagram Combined Flows.png 1,618 × 1,605; 252 KB
-
Plataforma continental1.jpg 350 × 149; 21 KB
-
Point bar.png 960 × 360; 296 KB
-
Post Depositional and Erosional Structures.jpg 4,220 × 4,526; 2.48 MB
-
Pressure solution sandstone.svg 1,100 × 560; 34 KB
-
Principales medios sedimentarios.svg 1,230 × 777; 603 KB
-
Principals medis sedimentaris.png 3,845 × 2,430; 1.47 MB
-
Rounding & sphericity EN.svg 743 × 310; 74 KB
-
Rounding & sphericity ES.svg 692 × 422; 63 KB
-
Rounding & sphericity NL.svg 743 × 310; 74 KB
-
Rounding.gif 2,152 × 1,134; 125 KB
-
Saltation on sand dune.png 337 × 129; 4 KB
-
Saltation-mechanics-i18n.png 741 × 474; 156 KB
-
Saltation-mechanics.gif 270 × 176; 26 KB
-
Sampling for Dating Sand Blows.jpg 1,108 × 708; 91 KB
-
Sandstorm Illustration HE.svg 1,900 × 1,150; 46 KB
-
Sediment core - line scan and X-ray image.png 2,067 × 4,601; 741 KB
-
Sediment core collection and processing.jpg 1,921 × 1,817; 2.21 MB
-
Sediment echosounder hg.png 1,000 × 702; 1.07 MB
-
Sediment Gravity Flows and Processes.jpg 5,500 × 3,517; 2.06 MB
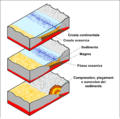
-
Sedimentacion.jpg 1,231 × 1,274; 246 KB
-
SedimentaryEnvironment.jpg 1,400 × 1,050; 132 KB
-
Sediments detritics ambé transpòrt per lei rius.png 1,359 × 593; 184 KB
-
Sediments detritics dei zònas de convergéncia.png 1,005 × 998; 199 KB
-
Sedimentàries (Strahler 1992).png 3,059 × 2,239; 502 KB
-
Settling velocity quartz.png 1,890 × 1,300; 63 KB
-
Shelf and Deep Marine Depositional Environment.jpg 2,736 × 1,824; 1.1 MB
-
Shells and Shell Like Things.jpg 5,500 × 4,250; 1.96 MB
-
Shields Diagram - Example Problem.jpg 813 × 512; 179 KB
-
Shields-vRijn-Breusers.jpg 2,429 × 773; 216 KB
-
Solutiondif.jpeg 557 × 284; 20 KB
-
Sorting in sediment.svg 670 × 315; 58 KB
-
Source to basin.png 999 × 973; 53 KB
-
Stream Load.gif 686 × 368; 9 KB
-
Strickler's equation.png 2,604 × 1,875; 74 KB
-
Structures formed by changes in flow direction or strength.jpg 3,004 × 4,298; 2.15 MB
-
Structures from unidirectional flow.jpg 5,174 × 3,866; 3.32 MB
-
Struttura.svg 743 × 611; 493 KB
-
Subglacial aquatic sediment continuous coring.jpg 267 × 550; 56 KB
-
Swamp and Desert Depositional Environment.jpg 2,736 × 1,824; 1.16 MB
-
Tidal flat general sketch.png 960 × 720; 113 KB
-
Tidal flat sedimentary structures.PNG 960 × 720; 69 KB
-
Tidal plain generale scheme.PNG 960 × 720; 113 KB
-
Tidal Rhythmites.jpg 2,822 × 2,022; 3.14 MB
-
Transportation by wind.jpg 598 × 179; 47 KB
-
Tuffite.jpg 2,665 × 1,550; 231 KB
-
Turbidite formation.jpg 3,003 × 2,093; 783 KB
-
Turbidite.png 2,414 × 1,451; 260 KB
-
Types of Carbonate platform He.jpg 1,200 × 658; 125 KB
-
Warm-kaltzeit hg.png 786 × 979; 173 KB
-
Warmzeit hg.png 782 × 537; 51 KB
-
Water wet oil Sand.svg 654 × 594; 23 KB
-
Waveheight.jpg 847 × 718; 31 KB
-
Waves and Oscillating.jpg 4,831 × 3,783; 1.87 MB
-
Wentworth scale.png 1,106 × 1,490; 357 KB
-
Wentworth-Grain-Size-Chart.pdf 1,275 × 1,650; 82 KB
-
Zasada Diagramm.jpg 1,639 × 1,000; 496 KB
-
Елементи залягання пласта.gif 867 × 776; 117 KB
-
Констративный аллювий.JPG 2,856 × 1,199; 645 KB
-
แผนภาพการทับทมของตะกอน.png 1,230 × 777; 236 KB


