Category:SVG line charts
Jump to navigation
Jump to search
Media in category "SVG line charts"
The following 200 files are in this category, out of 304 total.
(previous page) (next page)-
100 Women Days 2023–24 Artikel je Tag.svg 709 × 319; 36 KB
-
100 Women Days 2023–24 Durchschnitt.svg 709 × 319; 37 KB
-
100 Women Days 2023–24 Gesamtzahl.svg 709 × 319; 38 KB
-
100 Women Days 2024–25 Artikel je Tag.svg 756 × 340; 19 KB
-
100 Women Days 2024–25 Durchschnitt.svg 756 × 340; 19 KB
-
100 Women Days 2024–25 Gesamtzahl.svg 756 × 340; 17 KB
-
1800- Global carbon dioxide emissions, per person.svg 1,200 × 675; 5 KB
-
1850- Annual emissions of carbon dioxide, by country.svg 1,200 × 675; 20 KB
-
1850- Cumulative emissions of carbon dioxide, by country.svg 1,200 × 675; 17 KB
-
1880- Global average sea level rise (SLR) - annually.svg 1,200 × 675; 6 KB
-
1880- Global average sea surface temperature - global warming.svg 1,200 × 900; 8 KB
-
1900-2300 Long-term projections of sea level rise.svg 1,200 × 675; 5 KB
-
1907- Income inequality and union participation.svg 1,000 × 750; 8 KB
-
1910- Fertility rate - United States.svg 1,200 × 675; 4 KB
-
1951+ Percent of global area at temperature records - Seasonal comparison - NOAA.svg 2,000 × 1,400; 22 KB
-
1953- Funding for research and development - US.svg 1,000 × 750; 6 KB
-
1960- Groundwater loss - depletion - Central Valley of California.svg 1,200 × 675; 4 KB
-
1960- Heat wave indicators - US.svg 1,200 × 675; 2 KB
-
1960- Tax rates of richest versus low income people - US.svg 1,000 × 750; 6 KB
-
1965- Fertility rate - United States.svg 1,200 × 675; 7 KB
-
1970- Decline in species populations - Living Planet Index.svg 1,200 × 675; 7 KB
-
1980- Natural gas production, by country.svg 1,200 × 675; 7 KB
-
1990- Annual greenhouse gas emissions - U.S. - line chart.svg 1,200 × 675; 5 KB
-
1990- AR-15 production as percentage of guns produced in US.svg 1,000 × 750; 4 KB
-
1990- Renewable energy production, by source cs.svg 1,000 × 750; 5 KB
-
1990- Renewable energy production, by source.svg 1,000 × 750; 5 KB
-
1994- Motor vehicle traffic deaths in road accidents, by country.svg 1,000 × 750; 6 KB
-
1997- Bowling centers, league members, and lanes - normalized.svg 1,000 × 750; 3 KB
-
1997- Bowling centers, league members, and lanes - raw numbers.svg 1,000 × 750; 3 KB
-
1997- Lanes per bowling center.svg 1,000 × 750; 2 KB
-
2000- Gun sales and NICS firearm background checks - U.S.svg 1,000 × 750; 6 KB
-
2004- "Climate change" as a search term - Google trends.svg 1,000 × 750; 14 KB
-
2010- Cost of renewable energy - IRENA.svg 1,000 × 750; 8 KB
-
2010- Fossil fuels vs Wind + Solar - electricity generation.svg 859 × 750; 8 KB
-
2012 meningitis cases.svg 1,800 × 1,200; 12 KB
-
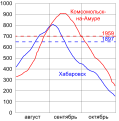
2013 Khabarovsk and Komsomolsk-na-Amure flood chart.svg 435 × 439; 116 KB
-
2015- Clean energy vs fossil fuel investment - IEA.svg 1,000 × 750; 3 KB
-
20200101 Life expectancy increases with age already achieved - chart.svg 1,000 × 750; 9 KB
-
20200101 Remaining life expectancy - US.svg 1,000 × 750; 9 KB
-
2021- COVID-19 death rates by vaccination status - US.svg 1,200 × 675; 7 KB
-
2022 Average and median family income, by age - US.svg 1,000 × 750; 3 KB
-
2022 Average and median family net worth, by age - US.svg 1,000 × 750; 3 KB
-
20221231 Energy generation in the United States - Rhodium Group.svg 1,000 × 750; 3 KB
-
202303 I worry "a great deal" about climate change - Gallup survey.svg 1,000 × 750; 5 KB
-
20230516 Toxic positivity - Google Trends search term history.svg 1,200 × 675; 6 KB
-
20230703 Average speed of bowling ball versus travel time.svg 1,000 × 750; 6 KB
-
2024 Accumulated Cyclone Energy Index compared to 30-year average.svg 1,000 × 750; 4 KB
-
20240524 Trump groundwork for election denial-ar.svg 1,000 × 750; 28 KB
-
20240524 Trump groundwork for election denial.svg 1,000 × 750; 5 KB
-
20240625 Global warming across generations - warming stripes.svg 1,200 × 1,090; 20 KB
-
20241116 "Fake news" (topic) on Google Trends.svg 1,000 × 750; 14 KB
-
20241116 "Gaslighting" (topic) on Google Trends.svg 1,000 × 750; 14 KB
-
20241119 "Toxic masculinity" (search term) on Google Trends.svg 1,000 × 750; 14 KB
-
Absorption spectra of monolayer graphene nanoribbons.svg 595 × 842; 188 KB
-
Admins by reg date 2016.svg 540 × 360; 37 KB
-
Allowing military service for LGBT.svg 450 × 316; 66 KB
-
Altitude decay of Mir.svg 1,920 × 1,080; 5.92 MB
-
Ammonium nitrate water phase diagram.svg 690 × 496; 842 KB
-
Angle de vision et coefficient de réflexion.svg 566 × 562; 19 KB
-
Arbeitslosenentwicklung 1933.svg 1,024 × 585; 883 KB
-
Arbeitslosigkeit im Reich.svg 1,020 × 600; 321 KB
-
Arccos, cos, and identity.svg 436 × 284; 26 KB
-
AreaDistributionCountries.svg 623 × 405; 79 KB
-
Arkansas-electricity-generation-1990-2012.svg 454 × 255; 258 KB
-
Atmospheric sound absorption coefficient.svg 512 × 384; 75 KB
-
Audience annuelle - TVA.svg 600 × 400; 28 KB
-
Audience trimestrielle - ICI Radio-Canada Télé.svg 600 × 400; 26 KB
-
Australian Population 1788 - 2007 (log scale).svg 512 × 512; 21 KB
-
Australian Population 1788 - 2007.svg 512 × 512; 21 KB
-
Australian Population growth rate 1792-1860.svg 512 × 512; 32 KB
-
Australian Population growth rate 1860-2007.svg 512 × 512; 36 KB
-
Babamın Sesi izlenme.svg 512 × 376; 14 KB
-
BaeckereiMedian.svg 2,759 × 2,200; 34 KB
-
Bar2e.png 321 × 223; 6 KB
-
Betreuungsmittelwert HessKifoeg 25c 2014.svg 800 × 650; 203 KB
-
Bevölkerungsentwicklung Helsinki 1875-2018.svg 799 × 403; 86 KB
-
Body mass index simplified.svg 429 × 425; 48 KB
-
Brachios vs bivalves fossil record.svg 800 × 340; 24 KB
-
Bracketing pairs.svg 306 × 212; 4 KB
-
Brendan - male given name - birth pop USA SS.svg 937 × 469; 38 KB
-
Brendon - male given name - birth pop USA SS.svg 937 × 469; 36 KB
-
Burnoutvel-eng.svg 1,200 × 1,000; 112 KB
-
Cdf-ecdf.svg 554 × 424; 42 KB
-
Chandra2.svg 724 × 600; 49 KB
-
Change of the operating kilometers of Kintetsu, Tōbu and Meitetsu.svg 1,036 × 730; 265 KB
-
Changes in US Money supply.svg 720 × 540; 48 KB
-
Chart - Russia for Russians (1998-2011).svg 1,340 × 745; 28 KB
-
Chart of US Top 1% Income Share (1913-2008).svg 999 × 713; 41 KB
-
Charts SVG Example 11 - Stacked Line Chart.svg 692 × 395; 6 KB
-
Charts SVG Example 15 - Text and Layout Adjustments.svg 576 × 463; 7 KB
-
Charts SVG Example 16 - Axis Adjustments.svg 692 × 401; 7 KB
-
Charts SVG Example 2 - Simple Line Chart.svg 692 × 401; 6 KB
-
Charts SVG Example 7 - Grouped Line Chart.svg 692 × 395; 6 KB
-
Components of US Money supply (logscale).svg 720 × 540; 90 KB
-
Components of US Money supply.svg 720 × 540; 57 KB
-
Composite Index of National Capability.svg 617 × 356; 20 KB
-
Computer-go-ratings-English.svg 493 × 347; 7 KB
-
Computer-go-ratings-Polish.svg 493 × 347; 7 KB
-
Cours de l'indice ATX depuis 1986.svg 600 × 400; 116 KB
-
Crude oil spread.svg 825 × 300; 57 KB
-
CyclingPowerComponents.svg 1,053 × 744; 38 KB
-
Czech election opinion polling chart.svg 1,208 × 702; 138 KB
-
Daewoo Matiz F8C motor curves and functional zones-fr.svg 1,150 × 950; 41 KB
-
Daewoo Matiz F8C power, consumption and torque-fr.svg 1,150 × 950; 28 KB
-
Daewoo Matiz F8C power, consumption and torque-hu.svg 1,145 × 948; 31 KB
-
Daewoo Matiz F8C wykresy mocy momentu i zużycia paliwa.svg 1,209 × 985; 39 KB
-
Daily Tumblr posts by year.svg 567 × 319; 12 KB
-
Deletions per month.svg 567 × 145; 16 KB
-
Deletions per second.svg 565 × 130; 13 KB
-
Detroit population and rank.svg 500 × 425; 9 KB
-
Devils-staircase.svg 480 × 480; 11 KB
-
Disneyland Park Adult Admission.svg 854 × 620; 64 KB
-
Disp bouss.svg 720 × 450; 33 KB
-
DMAX market share 2006 to 2014 (de).svg 774 × 517; 67 KB
-
Einwohner Magstadt.svg 800 × 500; 153 KB
-
Entwicklung Erwerbstätige Arbeitsvolumen Vollzeitäquivalente D.svg 985 × 733; 22 KB
-
Entwicklung Realohn Nominallohn Verbraucherpreisindex D.svg 768 × 432; 64 KB
-
ESPI out-of-plane.svg 454 × 306; 12 KB
-
Estimations of Human Brain Emulation Required Performance.svg 800 × 600; 49 KB
-
Etudiant superieur france.svg 512 × 410; 14 KB
-
Euro opinion Denmark.svg 600 × 300; 52 KB
-
Europe top 10 wind power capacity per capita.svg 4,751 × 2,985; 21 KB
-
Eurostar market shares.svg 577 × 328; 182 KB
-
EverestAscents.svg 1,300 × 975; 11 KB
-
Evolución del salario mínimo de Brasil 1990-2008.svg 600 × 480; 21 KB
-
Existing home sales chart.svg 552 × 227; 25 KB
-
Expected value continuous pdf 001.svg 680 × 450; 6 KB
-
Extragrundavdrag.svg 1,053 × 744; 12 KB
-
E^(-x^2).svg 600 × 480; 37 KB
-
Fa derivative11.svg 512 × 414; 17 KB
-
Federal Budget (1990-2000).svg 600 × 400; 21 KB
-
Fildertunnelgradiente2.svg 663 × 471; 18 KB
-
Firefox growth cumulative.svg 600 × 400; 3 KB
-
Firefox usage data.svg 650 × 400; 7 KB
-
Fracture Toughness Thickness Dependence.svg 964 × 619; 11 KB
-
FWHM 1.svg 512 × 410; 26 KB
-
G2hkhiv.svg 1,200 × 800; 480 KB
-
Gartenlaube Verteilung Anzahl Artikel je Autor und Jahre.svg 512 × 512; 58 KB
-
GDP BRICS G7.svg 1,100 × 480; 5 KB
-
GDP PPP per capita CIS.svg 1,130 × 550; 13 KB
-
GDP PPP Poland.svg 1,130 × 550; 24 KB
-
GDP PPP Russia.svg 1,130 × 590; 6 KB
-
GDP PPP Ukraine.svg 1,000 × 450; 4 KB
-
GDP PPP USA China.svg 1,200 × 500; 10 KB
-
Gen-Con-Attendance.svg 600 × 480; 18 KB
-
Geschenkökonomie.svg 697 × 504; 5 KB
-
Gew obj.svg 1,238 × 703; 156 KB
-
Gold-nominal-constant-usd.svg 2,311 × 1,419; 1.87 MB
-
Goodison-park-average-attendance.svg 1,400 × 450; 6 KB
-
Grade slope.svg 288 × 288; 8 KB
-
Graph of RfA Ratio over time.svg 1,155 × 585; 12 KB
-
Graph of x squared undefined at x equals 2.svg 450 × 450; 25 KB
-
Graph.svg 300 × 310; 84 KB
-
Half-age-plus-seven-relationship-rule.svg 755 × 798; 137 KB
-
HDI Ukraine.svg 1,000 × 490; 4 KB
-
Hemline (skirt height) overview chart 1805-2005.svg 1,180 × 590; 2 KB
-
Historical-cost-of-computer-memory-and-storage OWID.svg 850 × 600; 26 KB
-
Holyoke Immigration (1855-1920).svg 606 × 339; 244 KB
-
Homew2 1.svg 571 × 518; 4 KB
-
Hubbert curve.svg 512 × 435; 2 KB
-
Huber k rho function.svg 526 × 394; 24 KB
-
Image uploads on Wikimedia Commons (2003-2022).svg 600 × 371; 72 KB
-
Indice case shiller october 2011 all.svg 512 × 410; 68 KB
-
Indice case shiller october 2011.svg 512 × 410; 27 KB
-
Indiferentzia-kurba 01.svg 217 × 217; 7 KB
-
Iran internet users per 100 person.svg 512 × 336; 22 KB
-
Kernel logistic.svg 600 × 480; 7 KB


