Category:SVG created with Matplotlib
Jump to navigation
Jump to search
This message box is using an invalid "type=diffuse" parameter and needs fixing.
Subcategories
This category has the following 4 subcategories, out of 4 total.
Media in category "SVG created with Matplotlib"
The following 112 files are in this category, out of 112 total.
-
ACRO fatalities.svg 600 × 450; 50 KB
-
ACRO incidents.svg 600 × 450; 53 KB
-
Age structure aachen vs germany.svg 450 × 720; 32 KB
-
Al hydrolysis.svg 1,133 × 749; 64 KB
-
Beta distribution cdf.svg 566 × 425; 80 KB
-
Binary logarithm plot with ticks.svg 408 × 325; 56 KB
-
Canadian federal general elections.svg 1,207 × 507; 68 KB
-
Cauchy sequence illustration.svg 305 × 170; 50 KB
-
ChildLangmuirLawGraph1.svg 360 × 360; 16 KB
-
Conic 4xy+3y^2+2x+4y=0.svg 598 × 614; 65 KB
-
Conic x^2+2xy+y^2−8x=0.svg 743 × 470; 98 KB
-
Curve fitting.svg 512 × 384; 23 KB
-
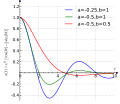
Damped Oscillation2.svg 444 × 386; 70 KB
-
Dirichlet kernels.svg 720 × 495; 57 KB
-
Evolution number articles WP-fr.svg 614 × 461; 49 KB
-
Expinvsq5.svg 720 × 540; 19 KB
-
FD e mu.svg 354 × 353; 62 KB
-
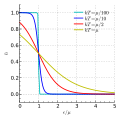
FD kT e.svg 358 × 363; 49 KB
-
Helmholtz coil, B magnitude cross section.svg 540 × 540; 250 KB
-
Himmelblau function.svg 720 × 540; 5.01 MB
-
Hyperbolic and exponential; cosh.svg 389 × 530; 72 KB
-
Hyperbolic and exponential; sinh.svg 319 × 503; 66 KB
-
Ideal gas isotherms.svg 305 × 314; 31 KB
-
Instability of Euler's method.svg 720 × 540; 23 KB
-
Laplaces method.svg 263 × 475; 24 KB
-
Levy0 distributionCDF.svg 413 × 419; 50 KB
-
Levy0 distributionPDF.svg 413 × 419; 51 KB
-
Levy0 LdistributionPDF.svg 484 × 428; 82 KB
-
Linear least squares example2.svg 279 × 274; 50 KB
-
Logarithm derivative.svg 375 × 243; 44 KB
-
Logarithmic Spiral Pylab.svg 512 × 512; 5 KB
-
Logistic cdf.svg 450 × 360; 39 KB
-
Logisticpdfunction.svg 450 × 360; 40 KB
-
Logit.svg 430 × 280; 4 KB
-
Master equation unravelings.svg 720 × 540; 453 KB
-
Matplotlib 3d v.svg 720 × 540; 282 KB
-
Matplotlib bar sample.svg 576 × 432; 21 KB
-
Matplotlib basic v.svg 720 × 540; 15 KB
-
Matplotlib scatter v.svg 720 × 540; 29 KB
-
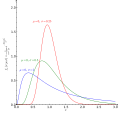
Maxwell-Boltzmann distribution cdf.svg 360 × 288; 33 KB
-
Maxwell-Boltzmann distribution pdf.svg 360 × 288; 32 KB
-
Mpl example qbo.svg 575 × 288; 198 KB
-
Mplwp Fabius function.svg 600 × 400; 39 KB
-
Mplwp gaussian wavepacket f4.svg 600 × 400; 38 KB
-
MössbauerSpectrum57Fe.svg 1,260 × 720; 40 KB
-
Nahrungszusammensetzung Wolf.svg 536 × 374; 14 KB
-
Nyquist example.svg 443 × 428; 53 KB
-
Octahedral geodesic polyhedron 02 00.svg 285 × 285; 6 KB
-
Octahedral geodesic polyhedron 03 00.svg 285 × 285; 12 KB
-
Octahedral geodesic polyhedron 04 00.svg 285 × 285; 21 KB
-
Octahedral geodesic polyhedron 05 00.svg 285 × 285; 33 KB
-
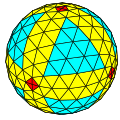
Octahedral geodesic polyhedron 05 05.svg 285 × 285; 96 KB
-
Octahedral geodesic polyhedron 06 00.svg 285 × 285; 47 KB
-
Octahedral geodesic polyhedron 07 00.svg 285 × 285; 63 KB
-
Octahedral geodesic polyhedron 08 00.svg 285 × 285; 82 KB
-
Octahedral geodesic polyhedron 09 00.svg 285 × 285; 104 KB
-
Octahedral goldberg polyhedron 02 00.svg 285 × 285; 5 KB
-
Octahedral goldberg polyhedron 03 00.svg 285 × 285; 9 KB
-
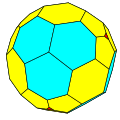
Octahedral goldberg polyhedron 04 00.svg 285 × 285; 16 KB
-
Octahedral goldberg polyhedron 05 00.svg 285 × 285; 24 KB
-
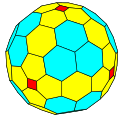
Octahedral goldberg polyhedron 05 05.svg 285 × 285; 71 KB
-
Octahedral goldberg polyhedron 06 00.svg 285 × 285; 34 KB
-
Octahedral goldberg polyhedron 07 00.svg 285 × 285; 47 KB
-
Octahedral goldberg polyhedron 08 00.svg 285 × 285; 60 KB
-
Octahedral goldberg polyhedron 09 00.svg 285 × 285; 76 KB
-
Opamprelaxationoscillator.svg 644 × 350; 57 KB
-
Parametric Helix.svg 305 × 314; 72 KB
-
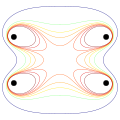
Poinsot1.svg 333 × 343; 20 KB
-
Powers chart.svg 668 × 564; 56 KB
-
Processor families in TOP500 supercomputers.svg 1,232 × 873; 549 KB
-
Pulse density modulation.svg 720 × 540; 69 KB
-
QBO Cycle observed.svg 900 × 360; 783 KB
-
Raised-cosine filter.svg 585 × 314; 42 KB
-
Random Walk example.svg 720 × 540; 30 KB
-
RationalDegree2byXedi.svg 398 × 398; 32 KB
-
Rod diameter change poisson.svg 444 × 429; 57 KB
-
Rosenbrock function.svg 720 × 540; 2.28 MB
-
Second order transfer function.svg 631 × 356; 80 KB
-
Some log-normal distributions.svg 593 × 561; 65 KB
-
Supercomputing-rmax-graph2.svg 1,260 × 810; 60 KB
-
Sweden2010RiksdagPolls-Coalitions.svg 870 × 474; 61 KB
-
Sweden2010RiksdagPolls-SmallParties.svg 869 × 474; 71 KB
-
Sweden2010RiksdagPolls.svg 956 × 474; 94 KB
-
Swineflu uk hpa model.svg 655 × 478; 61 KB
-
Synchrotron Functions.svg 540 × 360; 32 KB
-
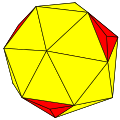
Tetrahedral geodesic polyhedron 02 00.svg 285 × 285; 3 KB
-
Tetrahedral geodesic polyhedron 03 00.svg 285 × 285; 7 KB
-
Tetrahedral geodesic polyhedron 04 00.svg 285 × 285; 11 KB
-
Tetrahedral geodesic polyhedron 05 00.svg 285 × 285; 17 KB
-
Tetrahedral geodesic polyhedron 06 00.svg 285 × 285; 24 KB
-
Tetrahedral geodesic polyhedron 07 00.svg 285 × 285; 32 KB
-
Tetrahedral geodesic polyhedron 08 00.svg 285 × 285; 42 KB
-
Tetrahedral geodesic polyhedron 09 00.svg 285 × 285; 52 KB
-
Tetrahedral Goldberg polyhedron 02 00.svg 285 × 285; 3 KB
-
Tetrahedral Goldberg polyhedron 03 00.svg 285 × 285; 5 KB
-
Tetrahedral Goldberg polyhedron 04 00.svg 285 × 285; 9 KB
-
Tetrahedral Goldberg polyhedron 05 00.svg 285 × 285; 13 KB
-
Tetrahedral Goldberg polyhedron 06 00.svg 285 × 285; 18 KB
-
Tetrahedral Goldberg polyhedron 07 00.svg 285 × 285; 24 KB
-
Tetrahedral Goldberg polyhedron 08 00.svg 285 × 285; 31 KB
-
Tetrahedral Goldberg polyhedron 09 00.svg 285 × 285; 39 KB
-
Top500 supercomputers performance development.svg 1,620 × 900; 80 KB
-
UKGeneralElection2010MoriPolls.svg 1,058 × 450; 93 KB
-
US Trade Balance 1960 2009.svg 765 × 495; 58 KB
-
US Trade Balance 1980 2009.svg 675 × 405; 54 KB
-
US Trade Balance 1980 2010.svg 675 × 405; 55 KB
-
US Trade Balance 1980 2011.svg 675 × 405; 55 KB
-
US Trade Balance 1980 2012.svg 675 × 405; 46 KB
-
US Trade Balance 1980 2014.svg 675 × 405; 49 KB
-
US Trade Balance from 1960.svg 894 × 552; 126 KB
-
Van der pols equation phase portrait.svg 438 × 533; 151 KB
-
Weight Growth of RN First Rate Line-of-Battle Ships 1630-1875.svg 720 × 540; 66 KB


