Category:Renewable energy statistics for the United States
Jump to navigation
Jump to search
Media in category "Renewable energy statistics for the United States"
The following 49 files are in this category, out of 49 total.
-
10 YR Profile of Renewables Electric Energy Generation in US.png 507 × 338; 15 KB
-
10 yr Profile of Wind Generated Electric Energy.jpg 480 × 289; 30 KB
-
1776 Historical energy consumption - U.S. - EIA data.svg 1,200 × 675; 6 KB
-
2000- Clean power installation - wind, solar, storage - US.svg 1,000 × 750; 3 KB
-
2004-2014 Renewable Electric Energy profile.png 528 × 355; 15 KB
-
2005-2016 Renewable Electric Energy Profile.jpg 476 × 296; 37 KB
-
2014 Contributions by Renewables to US Total Energy (11-).png 384 × 350; 15 KB
-
2014 Geo Thermal Electric Energy Generation Profile.png 504 × 342; 10 KB
-
2014 Wind Electric Energy Generation Profile.png 504 × 342; 11 KB
-
2015 Other Biomass Electric Energy Generation Profile.png 507 × 338; 12 KB
-
2015 Renewable Electric Energy Generation.png 481 × 288; 13 KB
-
2015 Top Five Hydro States.png 481 × 288; 8 KB
-
2015 Top Five States for Renewable Electric Energy.png 481 × 288; 7 KB
-
2015 Top Five Wind States.png 481 × 288; 9 KB
-
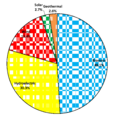
2015 US Renewables Pie Chart.png 363 × 338; 13 KB
-
2015 Wood Electric Energy Generation Profile.png 507 × 338; 12 KB
-
2015-2019 Capacity Projections.png 507 × 338; 11 KB
-
2016 Profile of Renewable Electric Energy.jpg 480 × 289; 41 KB
-
2016 Source of US Renewable Electric Energy 609.44.jpg 481 × 289; 23 KB
-
2016 Top Five States for Renewable Electric Energy.png 480 × 289; 7 KB
-
2016 Top HYDRO States.jpg 480 × 289; 31 KB
-
2018 State Geothermal Electric Generation.jpg 483 × 292; 20 KB
-
2018 State Hydro Electric Generation.jpg 483 × 409; 33 KB
-
2018 State Renewable Electric Generation.jpg 483 × 775; 59 KB
-
2018 State Utility Solar Electric Generation.jpg 483 × 387; 30 KB
-
2018 Top Ten States Biomass.jpg 483 × 292; 32 KB
-
2018 Top Ten States Geothermal.jpg 483 × 292; 25 KB
-
2018 Top Ten States Hydro.jpg 483 × 306; 27 KB
-
2018 Top Ten States Solar.jpg 483 × 309; 25 KB
-
2018 Top Ten States Wind.jpg 483 × 302; 29 KB
-
20220314 Renewable electricity generation - United States.svg 1,075 × 750; 7 KB
-
Monthly US Hydro Profile 2015.png 507 × 338; 11 KB
-
Projected US Renewable Electric Capacity.jpg 500 × 466; 68 KB
-
Renewable Electric Energy 10yr Actual 5yr predicted.png 509 × 370; 14 KB
-
Renewable Electric Energy 2004-2015 Actual 2016-2019 Projected.png 548 × 375; 17 KB
-
Renewable Electric Energy Profile.png 482 × 334; 13 KB
-
Renewable Electricity Production in the United States.svg 750 × 560; 28 KB
-
Renewable energy production in California.svg 750 × 560; 14 KB
-
Sources of Total US Renewable Energy.png 2,265 × 2,371; 36 KB
-
Timeline of electricity from renewable sources in the United States.png 2,487 × 1,361; 129 KB
-
United States Renewable Generation from EIA AEO 2014.png 1,024 × 768; 30 KB
-
US annual increase in renewable energy AEO 2015.png 1,024 × 768; 39 KB
-
US Electricity from renewables.png 566 × 315; 27 KB
-
US monthly renewable electricity generation.png 1,024 × 768; 90 KB
-
US Percent of Energy Exported-Projected-2050.png 1,600 × 400; 43 KB
-
US Renewable Electricity by Source.png 1,350 × 1,575; 27 KB


