Category:Rape statistics
Jump to navigation
Jump to search
Media in category "Rape statistics"
The following 30 files are in this category, out of 30 total.
-
A trend chart - total rapes and rape rates per 100000 people, India 2001 - 2012.png 3,000 × 1,851; 121 KB
-
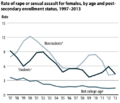
BJS Sexual Assualt Rates 1995-2013-ar.png 508 × 435; 29 KB
-
BJS Sexual Assualt Rates 1995-2013.png 508 × 435; 46 KB
-
Center for Disease Control sexual violence infographic.jpg 2,416 × 13,417; 4.16 MB
-
Diagram showing how rape statistics are formulated.GIF 911 × 384; 25 KB
-
Eurostat rapes reported to police in UK 2008-2015.png 645 × 288; 17 KB
-
Gráfico estupro 2.JPG 771 × 565; 34 KB
-
Gráfico estupro.JPG 675 × 566; 21 KB
-
International rape rates 2002.jpg 981 × 741; 178 KB
-
Males who force women to have sex.PNG 602 × 478; 22 KB
-
No.Rapes vs UrbanPopulation graph.jpg 558 × 557; 16 KB
-
Non genital injuries to women who are sexually assaulted.PNG 813 × 500; 111 KB
-
Rape in India in 2013.png 2,700 × 2,400; 346 KB
-
Rape perpetrator pie chart.PNG 713 × 503; 94 KB
-
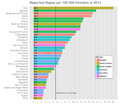
Rape rate per 100,000 - country comparison - United Nations 2012.png 1,099 × 650; 44 KB
-
Rape rate per 100000 population, World.png 2,000 × 1,161; 131 KB
-
Rape Rate-ar.png 563 × 351; 13 KB
-
Rape Rate.png 563 × 351; 8 KB
-
Rape rates for select countries -2012.png 1,729 × 824; 66 KB
-
Rapes per 1000 by sex 1995-2010.png 1,188 × 808; 57 KB
-
Rapes per 1000 people 1973-2003.jpg 938 × 701; 431 KB
-
Rate of exposure to sexual offences unchanged 2005-2013.svg 584 × 315; 41 KB
-
Sexual crimes in Sweden.png 1,153 × 654; 119 KB
-
Statistik våldtäkter.jpg 752 × 524; 72 KB
-
US Sexual Victimization 2014.png 1,084 × 805; 79 KB


