Category:Physiological graphs
Jump to navigation
Jump to search
Subcategories
This category has the following 2 subcategories, out of 2 total.
C
- Childbirth graphs (22 F)
G
- Glycemic index (7 F)
Media in category "Physiological graphs"
The following 41 files are in this category, out of 41 total.
-
AB by C- Joel Swanson.tif 851 × 497; 1.21 MB
-
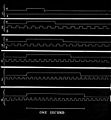
Alternative Breathing by Heartbeat.tif 851 × 497; 1.62 MB
-
Anti-HLA agglutinated RBC.png 256 × 294; 11 KB
-
BMR TEE age % Brain energy.png 3,208 × 1,949; 34 KB
-
BMR TEE brain energy change with age..png 2,964 × 1,808; 29 KB
-
Chimp A growth values.png 515 × 440; 6 KB
-
Flujotubo.jpg 496 × 702; 29 KB
-
Human infant grams per day growth wt fat ffbm protein.gif 802 × 696; 10 KB
-
Input Impedance and Phase Angle of Windkessel models.PNG 622 × 878; 86 KB
-
Ischemic preconditioning of the heart.png 1,342 × 932; 33 KB
-
Lymphocyte activation simple.svg 705 × 536; 16 KB
-
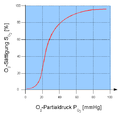
O2-Bindungskurve.png 536 × 508; 10 KB
-
Physiological effects of carbon dioxide concentration and exposure period.png 3,000 × 2,325; 414 KB
-
PRC-Light+Mel no.png 323 × 342; 14 KB
-
PRC-Light+Mel.png 323 × 342; 3 KB
-
PSM V06 D059 Myographical recording of muscle.jpg 1,378 × 1,019; 128 KB
-
PSM V06 D061 Tracings of impact of feet.jpg 1,363 × 285; 40 KB
-
PSM V06 D062 Vertical reaction register of paces.jpg 1,358 × 421; 74 KB
-
PSM V06 D063 Tracing produced by walking upstairs.jpg 1,360 × 280; 22 KB
-
PSM V06 D064 Tracing produced by human running.jpg 1,385 × 388; 56 KB
-
PSM V06 D065 Leap on two feet at once.jpg 1,357 × 582; 65 KB
-
PSM V06 D065 Man galloping with the right foot first.jpg 1,354 × 453; 61 KB
-
PSM V06 D066 Registration of man running.jpg 1,407 × 646; 70 KB
-
PSM V06 D066 Synoptical representation of human locomotion.jpg 1,412 × 484; 67 KB
-
PSM V06 D463 Animal movements traced.jpg 1,588 × 610; 213 KB
-
PSM V06 D465 Traced record of animal movement.jpg 1,600 × 525; 91 KB
-
PSM V06 D467 Graph of animal locomotion patterns.jpg 1,393 × 467; 38 KB
-
PSM V06 D469 Graph depicting bird wing movements.jpg 1,410 × 1,530; 177 KB
-
PSM V58 D490 Physical size differences between americans and cubans.png 2,555 × 1,251; 180 KB
-
PSM V58 D492 Physical size differences between americans and cubans.png 1,473 × 1,677; 291 KB
-
PSM V58 D493 Physical size differences between americans and cubans.png 1,531 × 1,726; 306 KB
-
PSM V58 D494 Physical size differences between americans and cubans.png 2,000 × 1,044; 190 KB
-
PSM V71 D201 Graph of the growth of boston schoolchildren in height and weight.png 1,622 × 1,441; 177 KB
-
PSM V71 D206 Graph of the growth of man from birth to maturity.png 1,638 × 1,173; 101 KB
-
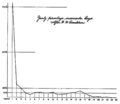
PSM V71 D212 Percentage of annual weight increments in boys by h h donaldson.png 1,652 × 1,438; 56 KB
-
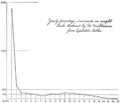
PSM V71 D212 Percentage of annual weight increments in boys from quetelet tables.png 1,685 × 1,337; 51 KB
-
PSM V71 D214 Percentage of annual weight increments in girls by h h donaldson.png 1,665 × 1,425; 76 KB
-
Reciennacido1.jpg 289 × 215; 21 KB
-
US A growth values.gif 654 × 554; 8 KB


