Category:Physics plots
Jump to navigation
Jump to search
Subcategories
This category has the following 10 subcategories, out of 10 total.
B
- Bode plots (1 P, 188 F)
E
H
M
N
P
- Plasma physics plots (50 F)
- Pole-zero plots (11 F)
S
- Step responses (79 F)
Media in category "Physics plots"
The following 139 files are in this category, out of 139 total.
-
3.b.ábra.png 960 × 720; 21 KB
-
3.c.ábra.png 960 × 720; 12 KB
-
3rd order intermod animation (thumbnail).png 300 × 188; 259 KB
-
5.a.ábra.png 978 × 720; 23 KB
-
5.b.ábra.png 960 × 720; 23 KB
-
6.ábra.png 960 × 720; 14 KB
-
7.ábra.png 960 × 720; 5 KB
-
8.ábra.png 960 × 720; 14 KB
-
AdaptLPFR.png 342 × 270; 3 KB
-
Angulo de extension.jpg 1,305 × 435; 198 KB
-
Angulo.jpg 1,333 × 435; 219 KB
-
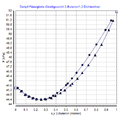
Azeotrop2-Butanon1,2-Dichlorethan.png 447 × 438; 11 KB
-
Ballistic trajectories.svg 600 × 600; 947 bytes
-
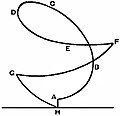
Britannica Boomerang Figure 2.jpg 498 × 410; 44 KB
-
Britannica Boomerang Figure 3.jpg 470 × 454; 45 KB
-
Classification-transmission.jpg 889 × 629; 56 KB
-
Color centers absorption spectra.jpg 815 × 589; 60 KB
-
CROdual.gif 821 × 480; 134 KB
-
CROsweep.gif 821 × 480; 46 KB
-
CROxoffset.gif 821 × 480; 220 KB
-
Density vs Temp at different Pressure.PNG 1,262 × 825; 40 KB
-
Dist maxwell partic resonant.png 414 × 250; 1 KB
-
Downstream Depth vs. Flow Rate Based on a Measured r.png 752 × 452; 14 KB
-
E-functie.JPG 459 × 353; 28 KB
-
Efficacités lumineuses log.png 1,366 × 1,508; 114 KB
-
Efficacités lumineuses milli.png 1,556 × 1,417; 125 KB
-
Efficacités lumineuses.png 635 × 691; 12 KB
-
Emissivite metal-dielectrique.png 771 × 663; 7 KB
-
Energy vs time at different timestep.PNG 667 × 784; 134 KB
-
Energy vs Time.PNG 1,083 × 455; 29 KB
-
Erdgvarp.png 431 × 330; 2 KB
-
Error vs Time.PNG 1,101 × 452; 23 KB
-
Exemplo 01 NC01.svg 480 × 320; 9 KB
-
Exemplo 02 NC01.svg 480 × 320; 7 KB
-
Exemplo 03 NC01.svg 480 × 320; 10 KB
-
F-center spectrum.png 871 × 593; 29 KB
-
Famille de convertisseur.gif 350 × 294; 9 KB
-
Figure showing variation of efficiency with loading .jpg 563 × 501; 36 KB
-
Figure4Wiki flicker sensitivity curves.jpg 907 × 491; 118 KB
-
Flux puissance et rendement.png 708 × 504; 6 KB
-
FMu(t).gif 360 × 227; 7 KB
-
Frequency Response of biqud band pass filter.gif 388 × 400; 125 KB
-
Física 17.png 332 × 210; 2 KB
-
Gammaray CrossSections Si.png 596 × 372; 13 KB
-
GLASER5a.png 2,048 × 2,532; 648 KB
-
Grafico potência em função do tempo.jpg 293 × 230; 8 KB
-
Grafiek.jpg 400 × 239; 10 KB
-
Graphe 2.PNG 618 × 507; 20 KB
-
Half times.png 372 × 221; 2 KB
-
Half times.svg 360 × 360; 1 KB
-
Hochlaufgeberspannungsverlauf.PNG 445 × 523; 2 KB
-
Inclinedthrow.gif 400 × 288; 374 KB
-
Ink viscosity as function of temperature (ink A).jpg 698 × 521; 20 KB
-
Int g(r) dr.PNG 638 × 467; 18 KB
-
Invcdf.jpg 269 × 195; 5 KB
-
IR emission in current greenhouse levels.png 531 × 477; 43 KB
-
IR emission with current greenhouse levels vs CO2 doubling.png 531 × 477; 45 KB
-
Irms.png 1,335 × 453; 20 KB
-
JL Cumulative Distribution Q.png 515 × 286; 36 KB
-
K-MIMS binding energy - Z2 Fitting-New.jpg 2,330 × 1,778; 1.64 MB
-
KapizaPendulumBottomPosition.jpg 1,200 × 900; 129 KB
-
Laminar.png 886 × 279; 25 KB
-
Masking threshold.gif 659 × 486; 10 KB
-
Master equation unravelings.svg 720 × 540; 453 KB
-
Maxwell dist ress partic landau-de.svg 800 × 440; 11 KB
-
Maxwell dist ress partic landau.png 396 × 250; 1 KB
-
Maxwell dist ress partic landau.svg 800 × 440; 11 KB
-
McCumberViolation.png 869 × 459; 49 KB
-
Messung Ansprechverhalten MRF-Daempfer.png 1,462 × 1,024; 76 KB
-
Mplwp ballistic trajectories angles.svg 600 × 400; 33 KB
-
Mplwp ballistic trajectories badminton.svg 600 × 400; 37 KB
-
Mplwp ballistic trajectories golfball.svg 600 × 400; 38 KB
-
Mplwp ballistic trajectories resistances.svg 600 × 400; 36 KB
-
Mplwp ballistic trajectories velocities.svg 600 × 400; 29 KB
-
Mplwp ballistic trajectory drag nodrag.svg 600 × 400; 37 KB
-
Mplwp ballistic trajectory.svg 600 × 400; 30 KB
-
Mplwp skydive trajectory.svg 480 × 500; 44 KB
-
MSD of liquid vs Time.png 1,115 × 598; 70 KB
-
MSD of liquid vs Timestep.png 1,021 × 618; 68 KB
-
MSD of solid vs Timestep.png 1,041 × 615; 58 KB
-
MSD of vapour vs Timestep.png 1,010 × 615; 72 KB
-
Nuclear potential - without text.png 585 × 389; 15 KB
-
Oscillations muon short.svg 363 × 250; 373 KB
-
Oteplovací zkratový proud.png 633 × 310; 74 KB
-
Paschen.png 1,317 × 1,111; 12 KB
-
Pavg.png 1,331 × 451; 21 KB
-
Perdidas acoplam.gif 548 × 303; 8 KB
-
Pinched crossing hysteresis.png 302 × 196; 2 KB
-
Poincaré Thermodynamique Fig2.png 440 × 448; 2 KB
-
Position vs Time.PNG 1,107 × 463; 21 KB
-
PositionVStemps.png 366 × 283; 3 KB
-
Pressure vs Time.PNG 850 × 548; 24 KB
-
PV, P-діаграма реального газу.png 1,404 × 1,853; 263 KB
-
Pyopus GUI.png 1,588 × 1,362; 345 KB
-
QuantumNoiseNonlinearMaping(Kuznetsov)Fig1.jpg 1,627 × 1,872; 284 KB
-
Radial Distribution Function.PNG 828 × 625; 43 KB
-
Radius vs. Flow Rate Based on a Measured y2.png 752 × 452; 16 KB
-
Raumkurve der Elektronenbahn 02.07.07.png 676 × 400; 16 KB
-
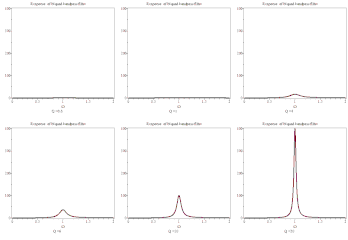
Repetitive-Impulse-Response.png 1,103 × 755; 12 KB
-
Rquant G(V).JPG 513 × 327; 9 KB
-
Running integral of liquid (one million atoms).png 928 × 574; 34 KB
-
Running integral of liquid(simulated).png 1,016 × 583; 36 KB
-
Running integral of solid (one million atoms).png 965 × 591; 44 KB
-
Running integral of vapour (one million atoms).png 896 × 591; 33 KB
-
Running integral of vapour (simulated).png 997 × 592; 34 KB
-
Running integral of vapour (solid).png 997 × 592; 44 KB
-
Sensitive-dependency.png 465 × 454; 23 KB
-
Shallow water model diagram.png 759 × 451; 14 KB
-
Sinusoidal Voltage and Current.gif 1,024 × 466; 28 KB
-
SpanwiseActuatorYVelocity.jpg 830 × 591; 32 KB
-
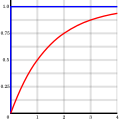
Stapresponsie.gif 344 × 401; 5 KB
-
Stromflusswinkel.GIF 470 × 436; 6 KB
-
Temperature vs time.PNG 814 × 552; 19 KB
-
Température de couleur du rayonnement solaire.png 1,022 × 768; 107 KB
-
Température et durée de vie.png 788 × 498; 5 KB
-
Tension.jpg 1,331 × 394; 289 KB
-
Threshold2.gif 662 × 463; 10 KB
-
Total energy vs time at different timestep.PNG 735 × 443; 34 KB
-
Total energy vs Time.PNG 856 × 592; 22 KB
-
Two carrier 3rd order intermod measurement.png 1,200 × 750; 1.47 MB
-
Upstream Depth vs. Flow Rate Based on a Measured r.png 752 × 452; 13 KB
-
VACF for solid, liquid and harmonic oscillator.png 1,049 × 574; 80 KB
-
Vibratsioonispektrum.jpg 760 × 622; 51 KB
-
VitesseVStemps.png 366 × 283; 102 KB
-
Vrms.png 1,335 × 456; 19 KB
-
Water-rocket-altitude-graph.svg 450 × 320; 43 KB
-
Wykres.jpg 892 × 652; 65 KB
-
Xj1213positionvstime.png 1,189 × 500; 26 KB
-
Y1 vs. Flow Rate Based on a Measured y2.png 752 × 452; 13 KB
-
Zplot.svg 610 × 480; 15 KB
-
Аперыкрк.jpg 389 × 390; 39 KB
-
Пеленгаційні характеристики фазового пеленгатора.png 377 × 299; 6 KB
-
Работа конденсаторного контактора.jpg 1,147 × 2,303; 326 KB
-
Работа тирикона.jpg 1,136 × 1,131; 2.02 MB


