Category:Phylogenetic trees of human mtDNA haplogroups
Jump to navigation
Jump to search
|
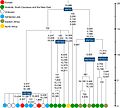
♀Evolutionary tree of human mitochondrial DNA (mtDNA) haplogroups | |||||||||||||||||||||||||||||||||||||
| Mitochondrial Eve (L) | |||||||||||||||||||||||||||||||||||||
| L0 | L1–6 | ||||||||||||||||||||||||||||||||||||
| L1 | L2 | L3 | L4 | L5 | L6 | ||||||||||||||||||||||||||||||||
| M | N | ||||||||||||||||||||||||||||||||||||
| CZ | D | E | G | Q | O | A | S | R | I | W | X | Y | |||||||||||||||||||||||||
| C | Z | B | F | R0 | pre-JT | P | U | ||||||||||||||||||||||||||||||
| HV | JT | K | |||||||||||||||||||||||||||||||||||
| H | V | J | T | ||||||||||||||||||||||||||||||||||
Media in category "Phylogenetic trees of human mtDNA haplogroups"
The following 72 files are in this category, out of 72 total.
-
Backbone of the phylogenetic tree of R0 subclades.jpg 1,200 × 777; 103 KB
-
Basal tree encompassing the roots of Native American mtDNA haplogroups.png 1,800 × 1,196; 487 KB
-
Classification tree of M9a'b rooted in haplogroup M9.jpg 1,200 × 1,414; 358 KB
-
Complete mtDNA phylogenetic tree of haplogroup C.png 2,063 × 715; 68 KB
-
Complete mtDNA phylogenetic tree of haplogroup D.png 2,055 × 1,026; 119 KB
-
Complete mtDNA phylogenetic tree of haplogroup U5.png 4,133 × 2,626; 154 KB
-
Complete mtDNA phylogenetic tree of subhaplogroup C5c.png 991 × 1,954; 45 KB
-
Complete mtDNA phylogenetic tree of subhaplogroup D4b1a2.png 2,055 × 2,461; 85 KB
-
Human mitochondrial DNA haplogroups.jpg 1,200 × 451; 30 KB
-
Maximum parsimony tree of entire mtDNA genomes belonging to haplogroup HV4.png 2,927 × 2,116; 544 KB
-
Maximum parsimony tree of haplogroup B2b.png 2,042 × 1,161; 595 KB
-
Maximum parsimony tree of haplogroup M35 mitogenomes.png 4,096 × 3,490; 1.76 MB
-
Maximum parsimony tree of haplogroup M5 Romani mitogenomes.png 4,078 × 3,027; 1.44 MB
-
Maximum parsimony tree of haplogroup U3 mitogenomes.png 4,052 × 2,476; 521 KB
-
Maximum parsimony tree of the Spanish Romani mitogenomes.png 4,017 × 2,913; 731 KB
-
Median joining phylogenetic tree of haplogroup C1 complete mitochondrial genomes.png 2,771 × 1,464; 107 KB
-
Mitochondrial eve tree.gif 544 × 450; 9 KB
-
MtDNA Haplogroup E phylogeny.png 2,756 × 2,149; 592 KB
-
MtDNA Haplogroup P phylogeny for Near Oceania.png 2,756 × 2,089; 938 KB
-
MtDNA Haplogroup Q phylogeny.png 2,756 × 1,844; 650 KB
-
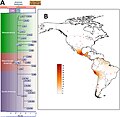
MtDNA haplogroup tree and distribution map.gif 2,820 × 1,365; 380 KB
-
MtDNA Q2 haplogroup tree.png 2,443 × 3,882; 278 KB
-
MtDNA tree analysis in Southeast Asia.jpg 1,200 × 551; 183 KB
-
MtDNA tree.jpg 852 × 680; 60 KB
-
MtDNAtreeHuman.svg 308 × 227; 4 KB
-
Overview of the mtDNA Q haplogroup.png 3,052 × 2,294; 222 KB
-
Phylogenetic tree based on the mtDNA distances.png 944 × 1,631; 41 KB
-
Phylogenetic tree of haplogroup mtDNA K1a1b1.jpg 946 × 419; 59 KB
-
Phylogenetic tree of haplogroups N1a1b and W.png 4,806 × 2,613; 675 KB
-
Phylogenetic tree of human mtDNA.png 4,118 × 3,708; 1.69 MB
-
Phylogenetic tree of mtDNA haplogroup A8.png 2,535 × 4,800; 442 KB
-
Phylogenetic tree of mtDNA haplogroup HV1b.jpg 946 × 848; 102 KB
-
Phylogenetic tree of mtDNA haplogroup HV2.png 2,717 × 1,991; 289 KB
-
Phylogenetic tree of mtDNA haplogroup J1b.jpg 1,200 × 787; 98 KB
-
Phylogenetic tree of mtDNA haplogroup K2a2.jpg 946 × 1,306; 79 KB
-
Phylogenetic tree of mtDNA haplogroup M.jpg 1,200 × 931; 217 KB
-
Phylogenetic tree of mtDNA haplogroup M1.jpg 1,200 × 1,473; 163 KB
-
Phylogenetic tree of mtDNA haplogroup N1b.jpg 946 × 636; 101 KB
-
Phylogenetic tree of mtDNA haplogroup N3.png 1,604 × 1,958; 157 KB
-
Phylogenetic tree of mtDNA haplogroup R2.png 3,747 × 2,069; 420 KB
-
Phylogenetic Tree Relating mrDNA Haplogroup B4a1 Complete Sequences.png 4,200 × 2,653; 174 KB
-
Phylogeny and distribution of mtDNA haplogroup C1b.jpg 926 × 900; 123 KB
-
Phylogeny of African haplogroups.png 3,857 × 2,326; 111 KB
-
Phylogeny of complete mtDNA sequences belonging to haplogroup A2.png 1,800 × 1,497; 917 KB
-
Phylogeny of complete mtDNA sequences belonging to haplogroups A2ad and A2af.png 3,443 × 1,912; 352 KB
-
Phylogeny of complete mtDNA sequences belonging to haplogroups B2, C1 and D1.png 1,800 × 1,700; 942 KB
-
Phylogeny of haplogroup H.png 2,067 × 1,184; 426 KB
-
Phylogeny of mtDNA haplogroup P1.gif 779 × 620; 54 KB
-
Phylogeny of mtDNA haplogroup R0.png 2,067 × 963; 310 KB
-
Phylogeny of mtDNA Haplogroups.png 913 × 1,236; 184 KB
-
Reconstructed phylogeny of mtDNA macrohaplogroup M tree.jpeg 3,580 × 2,355; 1.91 MB
-
Schematic phylogenetic tree of mtDNA haplogroup H1.jpg 946 × 690; 146 KB
-
Schematic phylogenetic tree of mtDNA haplogroup H6a1a.jpg 946 × 411; 77 KB
-
Schematic phylogenetic tree of mtDNA haplogroup J1c.jpg 946 × 459; 71 KB
-
Schematic phylogeny of mtDNA haplogroup L2.jpg 926 × 412; 50 KB
-
Schematic representation of phylogeny of human mtDNA outside of Africa.png 2,717 × 4,592; 210 KB
-
Schematic tree of haplogroup L0 and the root of the human mtDNA diversity.png 1,785 × 1,664; 142 KB
-
Schematic tree of mtDNA haplogroup J.png 2,630 × 1,104; 444 KB
-
Schematic tree of mtDNA haplogroup T.png 2,400 × 1,166; 409 KB
-
Schematic tree of mtDNA haplogroups L4 and L6.png 1,640 × 2,521; 127 KB
-
Schematic tree of the subclades most representative in SEA.jpg 750 × 603; 99 KB
-
Simplified phylogeny of mtDNA L haplogroup.PNG 2,918 × 2,076; 189 KB
-
Simplified phylogeny of mtDNA M1 haplogroup.png 2,640 × 1,468; 84 KB
-
Simplified phylogeny of mtDNA U6 haplogroup.png 3,247 × 2,039; 141 KB
-
Skeleton of the global mtDNA haplogroup C1b phylogeny.jpg 926 × 689; 144 KB
-
The distribution of mitochondrial haplogroups around the world.png 3,785 × 1,864; 77 KB
-
Upper Pleistocene macrohaplogroup M phylogeny for Near Oceania.png 2,756 × 1,811; 842 KB


