Category:Petroleum statistics
Jump to navigation
Jump to search
See also:
Subcategories
This category has the following 7 subcategories, out of 7 total.
Media in category "Petroleum statistics"
The following 187 files are in this category, out of 187 total.
-
Alaska Oil Production 1975 to 2005.png 500 × 500; 9 KB
-
Alaska Olie 1973-2009.png 3,388 × 2,083; 277 KB
-
Algerije Energie 1965-2010.png 1,800 × 1,200; 19 KB
-
Annual-co2-oil (OWID 0046).png 850 × 600; 94 KB
-
Bakken Oil Production ND.png 2,025 × 1,350; 27 KB
-
Balance de Petróleo, Venezuela.svg 720 × 540; 105 KB
-
Chart-of-Oil-Trading-Nation inverse.png 755 × 357; 6 KB
-
Clean Cities DOE Petroleum Reduction.jpg 800 × 630; 39 KB
-
Coal Balance Argentina.svg 1,248 × 672; 35 KB
-
Coal Balance Bangladesh.svg 990 × 540; 38 KB
-
Coal Balance Denmark.svg 990 × 540; 35 KB
-
Coal Balance Ecuador.svg 1,248 × 672; 36 KB
-
Coal Balance Iraq.svg 1,248 × 672; 33 KB
-
Coal Balance Kuwait.svg 1,248 × 672; 35 KB
-
Coal Balance Norway.svg 1,248 × 672; 34 KB
-
Coal Balance Oman.svg 1,248 × 672; 35 KB
-
Coal Balance Peru.svg 1,248 × 672; 37 KB
-
Coal Balance Saudi Arabia.svg 1,248 × 672; 37 KB
-
Coal Balance Sweden.svg 990 × 540; 37 KB
-
Coal Balance Switzerland.svg 990 × 540; 37 KB
-
Coal Balance Total Asia Pacific.svg 990 × 540; 62 KB
-
Coal Balance Trinidad & Tobago.svg 990 × 540; 36 KB
-
Oil Balance Colombia.svg 1,248 × 672; 83 KB
-
Conso prod pétr par secteur France.jpg 529 × 348; 34 KB
-
CountryMegaprojectContributions.svg 512 × 384; 14 KB
-
Crude oil prices, OWID.svg 850 × 600; 12 KB
-
Crude oil production in the United Kingdom, 1920-2016, OWID.svg 850 × 600; 9 KB
-
Crude oil spot prices, US$ per MWh, OWID.svg 850 × 600; 14 KB
-
EIA petroleum consumption of selected nations 11960-2008-ar.png 700 × 465; 45 KB
-
EIA petroleum consumption of selected nations 1960-1994.png 770 × 450; 48 KB
-
EIA petroleum consumption of selected nations 1960-1995.png 770 × 455; 49 KB
-
EIA petroleum consumption of selected nations 1960-1996.png 740 × 447; 49 KB
-
EIA petroleum consumption of selected nations 1960-1997.png 715 × 425; 38 KB
-
EIA petroleum consumption of selected nations 1960-1998.png 720 × 425; 47 KB
-
EIA petroleum consumption of selected nations 1960-1999.png 720 × 425; 47 KB
-
EIA petroleum consumption of selected nations 1960-2000.png 720 × 420; 48 KB
-
EIA petroleum consumption of selected nations 1960-2001.png 690 × 465; 47 KB
-
EIA petroleum consumption of selected nations 1960-2002.png 700 × 465; 49 KB
-
EIA petroleum consumption of selected nations 1960-2003.png 700 × 465; 48 KB
-
EIA petroleum consumption of selected nations 1960-2004.png 700 × 465; 50 KB
-
EIA petroleum consumption of selected nations 1960-2005.png 1,137 × 737; 51 KB
-
EIA petroleum consumption of selected nations 1960-2006.png 700 × 470; 51 KB
-
EIA petroleum consumption of selected nations 1960-2007.png 690 × 470; 50 KB
-
EIA petroleum consumption of selected nations 1960-2008.png 700 × 465; 52 KB
-
Energia per capita.PNG 500 × 658; 18 KB
-
Gas Balance Brunei.svg 1,248 × 672; 36 KB
-
Gas Balance Ecuador.svg 1,248 × 672; 35 KB
-
Gas Balance Japan.svg 990 × 540; 33 KB
-
Gas Balance Nigeria.svg 1,248 × 672; 36 KB
-
Gas Balance South Africa.svg 990 × 540; 32 KB
-
Gas Balance South Korea.svg 990 × 540; 35 KB
-
Gas Balance Sweden.svg 990 × 540; 35 KB
-
Gas Balance Switzerland.svg 990 × 540; 35 KB
-
Gas Balance Total Asia Pacific.svg 990 × 540; 71 KB
-
Gas Balance Yemen.svg 1,170 × 630; 36 KB
-
Global Carbon Emissions.png 310 × 233; 14 KB
-
Imported Crude Oil as a Percent of US Consumption 1950-2003.jpg 850 × 617; 155 KB
-
Int oil2.gif 252 × 255; 4 KB
-
MegaprojectFuelCategory.svg 512 × 384; 31 KB
-
New ELM Malaysia.svg 720 × 540; 77 KB
-
NewSupplyAdditions.svg 512 × 384; 28 KB
-
Number of deaths from indoor air pollution, 1990 vs. 2017, OWID.svg 850 × 600; 38 KB
-
Number of deaths from indoor air pollution, OWID.svg 850 × 600; 141 KB
-
Number of deaths from outdoor air pollution, OWID.svg 850 × 600; 141 KB
-
Oil and gas employees vs. rig count in the United States, OWID.svg 850 × 600; 12 KB
-
Oil Balance Algeria.svg 1,248 × 672; 82 KB
-
Oil Balance Angola.svg 1,248 × 672; 37 KB
-
Oil Balance Argentina.svg 1,248 × 672; 84 KB
-
Oil Balance Australia.svg 1,248 × 672; 85 KB
-
Oil Balance Azerbaijan.svg 990 × 540; 75 KB
-
Oil Balance Bangladesh.svg 990 × 540; 34 KB
-
Oil Balance Brazil.svg 1,248 × 672; 83 KB
-
Oil Balance Brunei.svg 1,248 × 672; 37 KB
-
Oil Balance Canada.svg 990 × 540; 76 KB
-
Oil Balance Chad.svg 1,248 × 672; 37 KB
-
Oil Balance China.svg 990 × 540; 75 KB
-
Oil Balance Denmark.svg 990 × 540; 79 KB
-
Oil Balance Ecuador.svg 1,248 × 672; 83 KB
-
Oil Balance Egypt.svg 1,248 × 672; 83 KB
-
Oil Balance Equatorial Guinea.svg 1,248 × 672; 39 KB
-
Oil Balance Gabon.svg 1,248 × 672; 37 KB
-
Oil Balance Germany.svg 990 × 540; 37 KB
-
Oil Balance India.svg 1,248 × 672; 82 KB
-
Oil Balance Indonesia.svg 1,248 × 672; 83 KB
-
Oil Balance Iran.svg 1,248 × 672; 82 KB
-
Oil Balance Italy.svg 1,248 × 672; 85 KB
-
Oil Balance Japan.svg 990 × 540; 34 KB
-
Oil Balance Kazakhstan.svg 990 × 540; 75 KB
-
Oil Balance Kuwait.svg 1,248 × 672; 82 KB
-
Oil Balance Libya.svg 1,248 × 672; 37 KB
-
Oil Balance Malaysia.svg 1,248 × 672; 84 KB
-
Oil Balance Mexico.svg 990 × 540; 78 KB
-
Oil Balance Nigeria.svg 1,248 × 672; 35 KB
-
Oil Balance Norway.svg 1,248 × 672; 85 KB
-
Oil Balance Other Africa.svg 1,248 × 672; 38 KB
-
Oil Balance Other Asia Pacific.svg 1,248 × 672; 84 KB
-
Oil Balance Other S. & Cent. America.svg 1,248 × 672; 37 KB
-
Oil Balance Pakistan.svg 990 × 540; 34 KB
-
Oil Balance Peru.svg 1,248 × 672; 81 KB
-
Oil Balance Qatar.svg 1,248 × 672; 82 KB
-
Oil Balance Romania.svg 1,248 × 672; 84 KB
-
Oil Balance Russian Federation.svg 990 × 540; 76 KB
-
Oil Balance Saudi Arabia-ar.svg 768 × 576; 58 KB
-
Oil Balance Saudi Arabia.svg 1,248 × 672; 81 KB
-
Oil Balance South Africa.svg 990 × 540; 35 KB
-
Oil Balance South Korea.svg 990 × 540; 34 KB
-
Oil Balance South Sudan.svg 1,248 × 672; 37 KB
-
Oil Balance Sudan.svg 1,248 × 672; 36 KB
-
Oil Balance Sweden.svg 990 × 540; 34 KB
-
Oil Balance Switzerland.svg 990 × 540; 36 KB
-
Oil Balance Syria.svg 1,248 × 672; 38 KB
-
Oil Balance Thailand.svg 1,248 × 672; 83 KB
-
Oil Balance Total Africa.svg 990 × 540; 73 KB
-
Oil Balance Total Asia Pacific.svg 990 × 540; 76 KB
-
Oil Balance Total Europe & Eurasia.svg 720 × 540; 85 KB
-
Oil Balance Total Middle East.svg 576 × 432; 79 KB
-
Oil Balance Total North America.svg 576 × 432; 80 KB
-
Oil Balance Total S. & Cent. America.svg 990 × 540; 78 KB
-
Oil Balance Trinidad & Tobago.svg 990 × 540; 74 KB
-
Oil Balance Tunisia.svg 1,248 × 672; 36 KB
-
Oil Balance Turkmenistan.svg 990 × 540; 73 KB
-
Oil Balance Ukraine.svg 990 × 540; 34 KB
-
Oil Balance United Arab Emirates.svg 1,248 × 672; 84 KB
-
Oil Balance United Kingdom.svg 1,248 × 672; 85 KB
-
Oil Balance US.svg 990 × 540; 76 KB
-
Oil Balance USSR.svg 576 × 432; 79 KB
-
Oil Balance Uzbekistan.svg 990 × 540; 77 KB
-
Oil Balance Venezuela.svg 1,248 × 672; 82 KB
-
Oil Balance Vietnam.svg 1,248 × 672; 83 KB
-
Oil Balance Yemen.svg 1,248 × 672; 35 KB
-
Oil consumption by region, OWID.svg 850 × 600; 20 KB
-
Oil consumption per capita, OWID.svg 850 × 600; 18 KB
-
Oil consumption per day by region from 1980 to 2006 no labels.svg 600 × 450; 98 KB
-
Oil consumption per day by region from 1980 to 2006 solid2.svg 600 × 450; 134 KB
-
Oil consumption per day by region from 1980 to 2006 solid3.svg 600 × 450; 136 KB
-
Oil consumption per day by region from 1980 to 2006.svg 600 × 450; 204 KB
-
Oil consumption, OWID.svg 850 × 600; 141 KB
-
Oil imports by country.webp 6,141 × 2,690; 1.4 MB
-
Oil production by region, OWID.svg 850 × 600; 20 KB
-
Oil production, OWID.svg 850 × 600; 25 KB
-
Oil Proved Reserves, OWID.svg 850 × 600; 141 KB
-
Oil shale 02.jpg 1,403 × 1,053; 107 KB
-
Oiloutput1.gif 220 × 186; 5 KB
-
Oilprod2006.gif 227 × 171; 2 KB
-
OPEC members' net oil export revenues in 2000 through 2020 (50562182543).png 1,096 × 546; 67 KB
-
OPEC oil exports.png 575 × 287; 14 KB
-
OPEC Surplus Crude Capacity.png 600 × 424; 21 KB
-
Opecrev.gif 1,687 × 1,310; 36 KB
-
Opecrev.png 1,158 × 899; 113 KB
-
Petroledepuis1900.svg 512 × 362; 147 KB
-
Petroleparhab.png 838 × 467; 58 KB
-
Petroleum probabilities.gif 452 × 297; 22 KB
-
Prodpetrole.PNG 838 × 467; 52 KB
-
Relazione riserve produzione consumi petrolio europa.svg 813 × 545; 291 KB
-
Reserves energetiques mondiales.jpg 801 × 4,530; 815 KB
-
Riserve produzione petrolio diag barre.svg 500 × 375; 111 KB
-
Rohölimporte.svg 800 × 800; 30 KB
-
Saoedi-Arabië – aardoliedata.png 1,800 × 1,200; 152 KB
-
Texas Oil Production 1935 to 2005.png 500 × 500; 9 KB
-
Top 5 Importers of Petroleum-ar.png 2,200 × 1,700; 53 KB
-
Top 5 Importers of Petroleum.png 2,200 × 1,700; 44 KB
-
Top 5 Oil Exporters-ar.png 1,950 × 1,450; 46 KB
-
Top 5 Oil Exporters.png 1,950 × 1,450; 41 KB
-
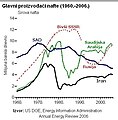
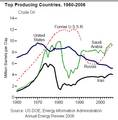
Top Oil Producing Counties (Cro).JPG 465 × 472; 37 KB
-
Top Oil Producing Counties Separación.png 465 × 472; 32 KB
-
Total World Oil Reserves Bar Chart.png 1,150 × 647; 26 KB
-
Total World Oil Reserves Conventional Unconventional-ar.png 1,281 × 721; 36 KB
-
Total World Oil Reserves Conventional Unconventional.png 1,281 × 721; 34 KB
-
Total World Oil Reserves.PNG 734 × 583; 34 KB
-
U.S. motor gasoline product supplied (49784554532).png 828 × 428; 48 KB
-
US imports of Russian Oil a Month.webp 1,286 × 490; 46 KB
-
US Net Oil Imports 1914-1930.png 1,950 × 1,450; 26 KB
-
US Oil Imports 1960-1990.png 1,950 × 1,450; 24 KB
-
Usesofpetroleum-ar.png 800 × 579; 91 KB
-
Usesofpetroleum.png 827 × 599; 45 KB
-
Venezuela oil production-exports.png 2,395 × 1,600; 471 KB
-
Venezuela oil revenues 1975 -.png 2,665 × 1,527; 350 KB
-
Venezuela-private-non-oil-exports.png 1,000 × 569; 31 KB
-
World energy consumption 2005-2035 EIA.png 640 × 480; 26 KB
-
World oil consumption 1980 to 2007 by region.svg 600 × 450; 101 KB
-
World oil consumption 91980 to 2007 by region-ar.png 1,280 × 960; 121 KB
-
World Oil Production 1960 to 2005.png 500 × 500; 8 KB
-
Доля нефтя место в Казахстане.png 1,819 × 1,099; 129 KB


