Category:Pathways diagrams
Jump to navigation
Jump to search

Media in category "Pathways diagrams"
The following 44 files are in this category, out of 44 total.
-
 13068 2022 2210 Fig2 HTML.webp 1,960 × 1,438; 203 KB
-
 5-HT2C receptor pathway.png 595 × 387; 41 KB
-
 Arnon Cycle.jpg 1,800 × 1,397; 256 KB
-
 Calvin-cycle4 ru.svg 836 × 766; 128 KB
-
 Calvin-cycle4 sk.svg 836 × 766; 31 KB
-
 Calvin-cycle4-ar.svg 776 × 754; 265 KB
-
 Calvin-cycle4-ptbr.svg 512 × 469; 112 KB
-
 Calvin-cycle4.svg 512 × 469; 36 KB
-
 Canonical and backdoor pathways to DHT biosynthesis.svg 1,270 × 1,040; 359 KB
-
 Diagram on graph paper (3740136939).jpg 1,632 × 1,224; 476 KB
-
 DNA damage, repair, epigenetic alteration of repair in cancer.jpg 2,404 × 2,628; 709 KB
-
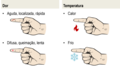 Dor e temperatura.png 1,468 × 908; 144 KB
-
 EMA401 Mechanism of Action.jpg 1,049 × 564; 413 KB
-
 Eye nerves diagram.svg 804 × 530; 164 KB
-
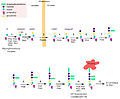
 Fatty acid synthesis (en) 01.svg 612 × 792; 64 KB
-
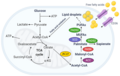
 Glycolytic and gluconeogenic pathways.jpg 1,000 × 1,273; 220 KB
-
 Gpi synthesis.jpg 4,187 × 3,455; 1.79 MB
-
 Ijms-23-02170-g001.png 3,038 × 1,920; 850 KB
-
 LPA Receptors Signaling Pathways.JPG 2,980 × 2,038; 1.57 MB
-
 Macroautophagy vs chaperone-mediated autophagy.png 1,705 × 1,379; 1,018 KB
-
 Marginal ore treatment.tif 916 × 185; 167 KB
-
 Medula espinhal cervical com raízes.png 1,801 × 432; 72 KB
-
 MTOR signal pathway.jpg 433 × 594; 54 KB
-
 Nervo pelo braço.png 1,724 × 1,224; 95 KB
-
 Neurofibromina deasactivación vía RAS.png 3,000 × 2,100; 1.27 MB
-
 Nucleus ER golgi ex.jpg 534 × 426; 49 KB
-
 Nucleus ER golgi.jpg 492 × 565; 62 KB
-
 Nucleus ER golgi.svg 492 × 565; 168 KB
-
 Orgo pathways.png 1,173 × 1,029; 394 KB
-

-
 Parkinson's disease pathway (Homo sapiens).png 1,000 × 754; 175 KB
-
 Pathological roles of VPS35.png 720 × 285; 62 KB
-
 Phosphoinositide Pathway Diagram.png 610 × 289; 26 KB
-
 PPAR-diagram.png 3,448 × 2,032; 2.72 MB
-
 Purine biosynthesis.jpg 652 × 698; 121 KB
-
 Reaction pathway for UCK2 in pyrimidine biosynthesis.png 3,656 × 2,597; 172 KB
-
 Reductive TCA cycle - ru.png 807 × 671; 65 KB
-
 Reductive TCA cycle.png 807 × 671; 55 KB
-
 Relevant molecular pathways and targeted agents in TNBC.jpg 728 × 850; 138 KB
-
 Targeted Pathways in TNBC.png 2,915 × 3,404; 3.96 MB
-

-
 Vias ascendentes.png 1,352 × 752; 71 KB
-
 VitaminD3 pathway.png 1,223 × 1,227; 68 KB
-
 WP3584.png 1,212 × 1,012; 155 KB


.jpg)


_01.svg)


.png)


