Category:PNG created with Mathematica
Jump to navigation
Jump to search
Subcategories
This category has only the following subcategory.
Media in category "PNG created with Mathematica"
The following 200 files are in this category, out of 460 total.
(previous page) (next page)-
2D Spherical Harmonic Orbitals.png 1,524 × 3,778; 1.19 MB
-
2D Wavefunction (1,1) Density Plot.png 800 × 800; 23 KB
-
2D Wavefunction (1,2) Density Plot.png 800 × 800; 24 KB
-
2D Wavefunction (1,3) Density Plot.png 800 × 800; 24 KB
-
2D Wavefunction (2,1) Density Plot.png 800 × 800; 29 KB
-
2D Wavefunction (2,2) Density Plot.png 800 × 800; 29 KB
-
2D Wavefunction (2,3) Density Plot.png 800 × 800; 29 KB
-
2D Wavefunction (3,1) Density Plot.png 800 × 800; 24 KB
-
2D Wavefunction (3,2) Density Plot.png 800 × 800; 25 KB
-
2D Wavefunction (3,3) Density Plot.png 800 × 800; 25 KB
-
2D Wavefunction small (1,1) Density Plot.png 300 × 300; 6 KB
-
2D Wavefunction small (1,3) Density Plot.png 300 × 300; 6 KB
-
2D Wavefunction small (2,2) Density Plot.png 300 × 300; 6 KB
-
2D Wavefunction small (2,3) Density Plot.png 300 × 300; 6 KB
-
2D Wavefunction small (3,1) Density Plot.png 300 × 300; 6 KB
-
2D Wavefunction small (3,2) Density Plot.png 300 × 300; 5 KB
-
2D Wavefunction small(1,2) Density Plot.png 300 × 300; 6 KB
-
2D Wavefunction small(3,3) Density Plot.png 300 × 300; 5 KB
-
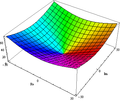
3d graph x2+xy+y2.png 573 × 404; 99 KB
-
3D Spherical Harmonic Orbitals (cutaway).png 1,044 × 3,911; 812 KB
-
3D tRR-eps-converted-to.jpg 1,730 × 1,225; 159 KB
-
A collection of 3D fractals named by their generating functions.png 1,214 × 1,726; 1.17 MB
-
A Lambert W function identity.jpg 436 × 251; 10 KB
-
A Trajectory Through Phase Space in a Lorenz Attractor.gif 200 × 200; 1.62 MB
-
A61-large.png 1,201 × 900; 22 KB
-
AbelianGroup(2, 2, 2) - a Cube.png 360 × 311; 27 KB
-
AbelianGroup(2,2) - a Sqaure.png 360 × 359; 12 KB
-
AbelianGroup(2,2,2,2) - a Tesseract.png 360 × 354; 53 KB
-
AiryAi Abs Surface.png 1,600 × 1,294; 528 KB
-
AiryAi Arg Surface.png 1,600 × 1,286; 383 KB
-
AiryAi Imag Surface.png 1,600 × 1,286; 708 KB
-
AiryBi Abs Surface.png 1,600 × 1,294; 626 KB
-
AiryBi Arg Surface.png 1,600 × 1,286; 656 KB
-
AiryBi Imag Surface.png 1,600 × 1,301; 873 KB
-
AiryBi Real Surface.png 1,600 × 1,300; 1.01 MB
-
Alan hesabi.gif 491 × 599; 26 KB
-
AllWindows.png 431 × 266; 8 KB
-
AlternatingGroup3-9.gif 240 × 209; 171 KB
-
Amoeba of x+y+z-1.png 720 × 582; 26 KB
-
Anti-Helmholtz-coil-field-3D.png 2,808 × 2,320; 907 KB
-
ARCHIQUANT Konstruction Hofstetter Kurt.jpg 3,543 × 3,543; 1.32 MB
-
AsymmetricLaplaceCDF.jpg 620 × 390; 90 KB
-
Atan2.png 1,000 × 800; 192 KB
-
Atom deBrogie.jpg 2,086 × 2,043; 166 KB
-
Baker constant.png 591 × 346; 61 KB
-
Bartlett.png 399 × 246; 5 KB
-
BenfordDensities.png 1,508 × 956; 74 KB
-
BenfordNarrow.gif 401 × 132; 5 KB
-
BJD planewave.gif 300 × 300; 229 KB
-
BottPeriodicityClock.gif 715 × 800; 282 KB
-
BoysSurfaceBeginningPassageway.PNG 341 × 347; 23 KB
-
BoysSurfaceBottomView.PNG 451 × 449; 33 KB
-
BoysSurfaceCaveEntrance.PNG 381 × 408; 27 KB
-
BoysSurfacePassageway.PNG 340 × 346; 25 KB
-
BoysSurfaceTopView.PNG 289 × 282; 9 KB
-
BunimovichStadium.png 1,024 × 539; 20 KB
-
Calabi-Yau-alternate.png 765 × 765; 786 KB
-
Calabi-yau.jpg 700 × 700; 185 KB
-
Calabi-Yau.png 840 × 840; 327 KB
-
Cantor-Funktion.svg 359 × 225; 33 KB
-
Cayley backward.gif 534 × 475; 1.55 MB
-
Cayley graph of Alternating Group A3.png 1,200 × 1,047; 30 KB
-
Cayley graph of Alternating Group A4.png 1,200 × 1,077; 97 KB
-
Cayley graph of Alternating Group A5.png 1,200 × 1,166; 243 KB
-
Cayley graph of Alternating Group A6.png 1,200 × 1,161; 793 KB
-
Cayley graph of Alternating Group A7.png 1,200 × 1,085; 1.66 MB
-
Cayley graph of Alternating Group A8.png 1,200 × 1,186; 2.36 MB
-
Cayley graph of Alternating group A9.png 1,200 × 1,158; 2.04 MB
-
CayleyGraphMathieuGroupM11.png 1,200 × 1,170; 2.29 MB
-
CayleyGraphSymmetricGroup5.png 800 × 789; 154 KB
-
CDF for skewed Beta distribution vs. x and beta= 5 alpha - J. Rodal.jpg 1,714 × 1,151; 209 KB
-
CDF for symmetric Beta distribution vs. x and alpha=beta - J. Rodal.jpg 1,599 × 1,056; 185 KB
-
Cis function coloring plot 3D.png 362 × 269; 19 KB
-
Cis function.png 820 × 816; 97 KB
-
CissoidOfDiocles.PNG 211 × 500; 4 KB
-
Clip image002.gif 273 × 226; 23 KB
-
Cocis function.png 820 × 816; 97 KB
-
Collatz1000mathematica.png 800 × 3,072; 240 KB
-
ComparacionMSKyPSK.PNG 595 × 394; 21 KB
-
ComparacionPSKyASK.PNG 569 × 337; 17 KB
-
Complex ArcSec.jpg 833 × 833; 72 KB
-
Complex coloring 3D.png 360 × 302; 31 KB
-
Complex coloring.jpg 456 × 430; 60 KB
-
Complex gamma function abs.png 902 × 680; 118 KB
-
Complex gamma function Re.png 897 × 677; 127 KB
-
Complex log.jpg 636 × 636; 97 KB
-
ComplexErf.jpg 288 × 288; 45 KB
-
ComplexEx2.jpg 288 × 288; 46 KB
-
Correlation examples.png 824 × 346; 15 KB
-
Covariantcomponents.gif 780 × 327; 763 KB
-
CrossCapSlicedOpen.PNG 773 × 419; 60 KB
-
CrossCapTwoViews.PNG 800 × 281; 54 KB
-
Current-loop-field-3D.png 2,600 × 1,680; 473 KB
-
Curve fitting.png 424 × 253; 14 KB
-
Curved line graph with labels.jpg 399 × 382; 15 KB
-
Curved line graph.jpg 399 × 382; 10 KB
-
D orbitals in an octahedron.jpg 1,267 × 783; 76 KB
-
D4.png 435 × 43; 2 KB
-
Daubechies20LowPassHighPass2DFilterM.png 800 × 583; 129 KB
-
De finetti diagram.png 500 × 500; 29 KB
-
Density matrix mixed states.jpg 600 × 898; 96 KB
-
Density matrix squeezed coherent states subpoisson.jpg 528 × 753; 72 KB
-
Density matrix squeezed vacuum.jpg 658 × 486; 50 KB
-
Density matrix thermal state.jpg 818 × 499; 62 KB
-
Derivatesinus.png 7,017 × 4,958; 92 KB
-
Differentiaal.png 794 × 1,123; 43 KB
-
Diffraction beats.gif 360 × 354; 277 KB
-
Dionysodorus Conics.png 781 × 430; 20 KB
-
Dirichlet distributions.png 885 × 763; 191 KB
-
Discriminant49CubicFieldFundamentalDomain.png 802 × 670; 10 KB
-
Discriminant49CubicFieldFundamentalDomainOfUnits.png 839 × 491; 38 KB
-
Disjoint ellipses.png 250 × 246; 11 KB
-
Distribuzione lorentziana.png 500 × 309; 3 KB
-
DOG vs MHF.png 486 × 900; 10 KB
-
Dottie number.png 724 × 603; 74 KB
-
Double Exponential Function.PNG 500 × 500; 3 KB
-
DritteSechsteEW.png 288 × 166; 2 KB
-
DualSnub24Cell-5a.png 1,042 × 1,250; 345 KB
-
E xy polarized.webm 15 s, 630 × 420; 1.8 MB
-
E8 142 Petrie Projection.png 1,072 × 1,077; 1.76 MB
-
E8 241 Petrie Projection.png 1,072 × 1,075; 1.62 MB
-
Electric-dipole-field-potential.png 1,439 × 1,079; 235 KB
-
Electric-field-terrain-model-3D.stl 5,120 × 2,880; 630 KB
-
Ellipsoid Quadric.png 750 × 829; 164 KB
-
EnneperSurface.PNG 406 × 356; 16 KB
-
Epsilon-Delta-Kriterium an einem Beispiel.gif 360 × 239; 33 KB
-
Error function plot.gif 818 × 366; 7 KB
-
Euler-Mas.jpg 541 × 351; 11 KB
-
EulerFormulaAsLimit.gif 200 × 204; 32 KB
-
EulerPhi.PNG 573 × 354; 13 KB
-
ExpIPi.gif 360 × 323; 11 KB
-
Extrema complex x hoch 3.jpg 400 × 400; 38 KB
-
Extrema complex x hoch 5.jpg 400 × 400; 39 KB
-
Extrema z over zminus1.jpg 400 × 400; 38 KB
-
Extrema z2 over z2minus1.jpg 400 × 400; 39 KB
-
Extrema z3 over z3minus1.jpg 400 × 400; 40 KB
-
Extrema z4 over z4minus1.jpg 400 × 400; 40 KB
-
Extrema z4minus02i over z4minus1.jpg 400 × 400; 41 KB
-
Extrema z4plus005 over z4minus1.jpg 400 × 400; 42 KB
-
Extrema z4plus1 over z4.jpg 400 × 400; 39 KB
-
Extrema z4plus1 over z4minus005.jpg 400 × 400; 42 KB
-
Extrema z4plus1 over z4minus1.jpg 400 × 400; 42 KB
-
Extrema z5 over z5minus1.jpg 400 × 400; 41 KB
-
Extrema z7 over z7minus1.jpg 400 × 400; 42 KB
-
FiltroRC PotenciaMathematica.gif 360 × 235; 3 KB
-
Firstsynchfunction.jpg 273 × 171; 3 KB
-
Foias constant.png 574 × 377; 33 KB
-
Fourier series for square wave.gif 480 × 360; 179 KB
-
Fourier series for trig poly high degree.gif 480 × 360; 19 KB
-
Fourier series for trig poly.gif 480 × 360; 55 KB
-
Frenet-Serret helices.png 529 × 406; 60 KB
-
Frenet-Serret moving frame1.png 172 × 315; 7 KB
-
FTC geometric.png 627 × 362; 10 KB
-
Funktion produkt aller zahlen.jpg 348 × 563; 25 KB
-
Gamma abs 3D.png 1,280 × 1,000; 453 KB
-
Gamma abs arg.png 2,000 × 1,460; 646 KB
-
Gamma3D.png 360 × 267; 21 KB
-
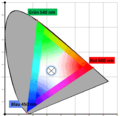
Gamut-effect.png 1,172 × 1,136; 43 KB
-
Gauss and Lorentz lineshapes.png 500 × 357; 15 KB
-
Gaussian curvature.JPG 383 × 265; 125 KB
-
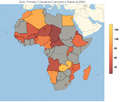
Girls'PrimaryEducationCompletionRates regional.png 482 × 411; 76 KB
-
Gnomonic.png 1,000 × 600; 114 KB
-
Gradient2.png 377 × 253; 28 KB
-
Grafico 3d x2+xy+y2.png 579 × 404; 142 KB
-
Grafplot3x1x2x3.png 864 × 381; 11 KB
-
Graph des horizontalen Sehwinkels.png 3,380 × 2,331; 519 KB
-
Graph des vertikalen Sehwinkels.png 3,393 × 2,397; 586 KB
-
Graph of function of 2 variables.gif 551 × 447; 53 KB
-
Graph of function of 2 variables.png 551 × 447; 109 KB
-
GraphKehrwertfunktion.png 831 × 541; 8 KB
-
GravityPotential.jpg 796 × 462; 197 KB
-
Guassian Dispersion.gif 360 × 223; 351 KB
-
H2OrbitalsAnimation.gif 300 × 204; 411 KB
-
Hamming.png 400 × 247; 5 KB
-
Hanning.png 399 × 246; 5 KB
-
Hash table average insertion time.png 954 × 620; 5 KB
-
Helicoid.PNG 407 × 394; 28 KB
-
Helmholtz zfield.png 1,359 × 870; 75 KB
-
Helmholtz-coil-field-3D.png 2,600 × 2,128; 670 KB
-
Helmholtzsplue Magnetfeld.png 993 × 696; 165 KB
-
Himmelblau Contour.jpg 1,000 × 1,000; 443 KB
-
HomogeneousDiscontinuousFunction.gif 360 × 289; 7 KB
-
HyperbolicParaboloid.png 270 × 366; 12 KB
-
Icosahedron-golden-rectangles.png 253 × 235; 17 KB
-
Ideal-solenoid-field-3D-2.png 3,200 × 2,080; 555 KB
-
Ideal-solenoid-field-3D.png 3,200 × 2,080; 592 KB
-
Ideal-solenoid-zfield-3D.png 3,200 × 2,080; 492 KB
-
Imaginary part of the Lambert W(n,x+i y) for various branches (n).jpg 1,100 × 1,002; 146 KB
-
Intervallschachtelung Eulersche Zahl n+1.gif 465 × 234; 6 KB
-
Irrational Rotation on a 2 Torus.png 360 × 359; 23 KB


