Category:Our World in Data graphics about gender
Jump to navigation
Jump to search
Subcategories
This category has only the following subcategory.
Media in category "Our World in Data graphics about gender"
The following 160 files are in this category, out of 160 total.
-
 A-third-of-all-countries-have-had-a-woman-as-leader 5032.png 5,032 × 3,776; 844 KB
-
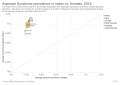 Asperger Syndrome prevalence in males vs. females, OWID.svg 850 × 600; 41 KB
-
 Asperger-syndrome-prevalence-males-vs-females.png 3,400 × 2,400; 478 KB
-
 Autism prevalence in males vs. females, OWID.svg 850 × 600; 41 KB
-
-
 Borrowing to start or expand business, men vs women, OWID.svg 850 × 600; 33 KB
-
 Cardiovascular-disease-death-rate-over-time-males-vs-females.png 3,400 × 3,398; 896 KB
-
 Child death rates by cause for boys vs. girls in India, OWID.svg 850 × 600; 11 KB
-
 Child mortality by sex (World Bank), OWID.svg 850 × 600; 44 KB
-
 Child mortality by sex, OWID.svg 850 × 600; 6 KB
-
 Children who experience violent discipline, boys vs girls, OWID.svg 850 × 600; 17 KB
-
 Comparing-the-share-of-men-and-women-who-are-smoking.png 3,302 × 1,873; 483 KB
-
 Condom use at last high-risk sex, OWID.svg 850 × 600; 6 KB
-
 Condom use during last high-risk sex by age, OWID.svg 850 × 600; 6 KB
-
 Countries-by-legal-status-of-same-sex-marriage.svg 850 × 600; 22 KB
-
 Countries-by-share-of-women-in-parliament.png 3,400 × 2,400; 513 KB
-
 Countries-in-which-same-sex-sexual-acts-are-legal.svg 850 × 600; 39 KB
-
 Countries-protecting-core-lgbt-rights.svg 850 × 600; 60 KB
-
 Decomposition of the gender wage gap, 1, OWID.svg 850 × 600; 8 KB
-
 Decomposition of the gender wage gap, OWID.svg 850 × 600; 8 KB
-
 Employment-to-population ratio, men vs women, OWID.svg 850 × 600; 32 KB
-

-
 Female employment-to-population ratio, 1, OWID.svg 850 × 600; 16 KB
-
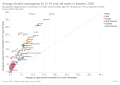
 Female employment-to-population ratio, 2016 vs 1980, OWID.svg 850 × 600; 18 KB
-
 Female employment-to-population ratio, OWID.svg 850 × 600; 16 KB
-
 Female labour force participation rate (15-64), OWID.svg 850 × 600; 12 KB
-

-
 Female to Male log Wage Ratio (Blau and Kahn (2017)), OWID.svg 850 × 600; 6 KB
-
 Female-to-male ratio of time devoted to unpaid care work, OWID.svg 850 × 600; 14 KB
-
 Fertility and female labor force participation, OWID.svg 850 × 600; 100 KB
-
 Five-year cancer survival rates by sex and race, OWID.svg 850 × 600; 15 KB
-
 Five-year-cancer-survival-rates-by-sex-and-race.png 3,400 × 2,400; 485 KB
-
 Gender difference in life expectancy, OWID.svg 850 × 600; 22 KB
-
 Gender gap in average wages, 2000 vs 2015, OWID.svg 850 × 600; 13 KB
-
-
 Gender ratios for mean years of schooling, OWID.svg 850 × 600; 16 KB
-
 Gender ratios for mean years of schooling.jpg 828 × 596; 72 KB
-
 Gender wage gap vs GDP per capita, 1, OWID.svg 850 × 600; 15 KB
-
 Gender wage gap vs GDP per capita, OWID.svg 850 × 600; 15 KB
-
 Global infant mortality by cause for boys vs. girls, OWID.svg 850 × 600; 9 KB
-
 Historical Gender Equality Index, OWID.svg 850 × 600; 9 KB
-
 Hourly Earnings.png 1,530 × 974; 246 KB
-
 Hours per week spent in leisure, by sex, United States, OWID.svg 850 × 600; 8 KB
-
 Hours per week spent on child care, United States, OWID.svg 850 × 600; 9 KB
-

-
 Human Capital Index in males vs. females, OWID.svg 850 × 600; 28 KB
-
 Infant mortality by sex, OWID.svg 850 × 600; 36 KB
-
-
 Informal employment, by sex, OWID.svg 850 × 600; 8 KB
-

-

-
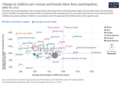
 Labour force participation, younger vs older women, OWID.svg 850 × 600; 36 KB
-
 Land ownership, men vs women, OWID.svg 850 × 600; 14 KB
-
 Land-ownership-men-vs-women (OWID 0591).png 850 × 600; 90 KB
-
 Life expectancy at age 15 by sex, OWID.svg 850 × 600; 16 KB
-
 Life expectancy at birth by sex, OWID.svg 850 × 600; 17 KB
-
 Life expectancy by country, males vs. females.svg 850 × 600; 71 KB
-

-
 Lung-cancer-deaths-per-100000-by-sex-1950-2002.png 3,400 × 2,400; 340 KB
-

-
 Male vs. female suicide rate, OWID.svg 850 × 600; 41 KB
-

-
 MDG3.A- Gender parity index (GPI) in education, OWID.svg 850 × 600; 8 KB
-
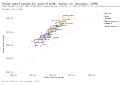 Mean adult height by year of birth, males vs. females, OWID.svg 850 × 600; 38 KB
-

-
 Number-of-daily-smokers-gender.png 3,400 × 2,400; 346 KB
-
 Numbercurrentsmokers.png 3,400 × 2,400; 294 KB
-
 Ordered milestones of women's political representation, OWID.svg 850 × 600; 27 KB
-
 Participation of women in purchase decisions, OWID.svg 850 × 600; 18 KB
-
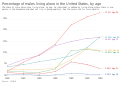
 Percentage of Americans living alone (1900-2016), OWID.svg 850 × 600; 12 KB
-
 Percentage of Americans living alone, by age, OWID.svg 850 × 600; 11 KB
-
-

-
-
 PISA- Mean performance on the mathematics scale, by sex, OWID.svg 850 × 600; 19 KB
-
 PISA- Mean performance on the reading scale, by sex, OWID.svg 850 × 600; 19 KB
-
 Prevalence of ADHD in males vs females, OWID.svg 850 × 600; 42 KB
-
 Prevalence of alcohol use disorders in males vs. females, OWID.svg 850 × 600; 43 KB
-
 Prevalence of anxiety disorders, males vs. females, OWID.svg 850 × 600; 42 KB
-
 Prevalence of bipolar disorder in males vs. females, OWID.svg 850 × 600; 42 KB
-
 Prevalence of childhood stunting, male vs. female, OWID.svg 850 × 600; 10 KB
-
 Prevalence of depression, males vs. females, OWID.svg 850 × 600; 43 KB
-

-
 Prevalence of drug use disorders, males vs females, OWID.svg 850 × 600; 43 KB
-
 Prevalence of eating disorders in males vs. females, OWID.svg 850 × 600; 42 KB
-
 Prevalence of schizophrenia in males vs. females, OWID.svg 850 × 600; 43 KB
-
 Prevalence-adhd-in-males-vs-females.png 3,400 × 2,400; 502 KB
-
 Prevalence-of-eating-disorders-in-males-vs-females.png 3,400 × 2,400; 504 KB
-
 Proportion of female employees by economic sector, OWID.svg 850 × 600; 10 KB
-
 Proportion of women participating in the labor force, OWID.svg 850 × 600; 32 KB
-
 Ratio of female to male labor force participation rates, OWID.svg 850 × 600; 24 KB
-
 Ratio of female-to-male median earnings by age, US, OWID.svg 850 × 600; 11 KB
-

-
 SDF hommes femmes nuit selon OCDE 2023.jpg 1,199 × 902; 240 KB
-
 Sex ratio at birth (Chao et al. (2019)), OWID.svg 850 × 600; 17 KB
-

-
 Sex ratio at birth by birth order, OWID.svg 850 × 600; 16 KB
-
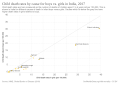
 Sex ratio at birth vs. at five years old, OWID.svg 850 × 600; 37 KB
-
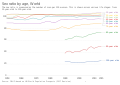 Sex ratio by age, OWID.svg 850 × 600; 15 KB
-
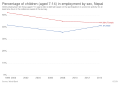
 Share of children in employment, boys vs girls, OWID.svg 850 × 600; 18 KB
-

-
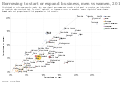
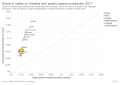
 Share of firms with female top managers, OWID.svg 850 × 600; 7 KB
-

-
 Share of male vs female employment in agriculture, OWID.svg 850 × 600; 37 KB
-
 Share of male vs female employment in industry, OWID.svg 850 × 600; 37 KB
-
 Share of male vs female employment in services, OWID.svg 850 × 600; 38 KB
-
 Share of males vs. females with autistic spectrum disorder, OWID.svg 850 × 600; 42 KB
-

-

-

-
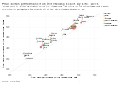
 Share of overweight men vs. women, OWID.svg 850 × 600; 38 KB
-
 Share of people who prefer a male vs a female boss, OWID.svg 850 × 600; 6 KB
-
 Share of people who report preference for a male boss, OWID.svg 850 × 600; 7 KB
-

-

-

-

-
 Share of women among low pay earners, OWID.svg 850 × 600; 8 KB
-
 Share of women in low-wage occupations in the US, OWID.svg 850 × 600; 6 KB
-
 Share of women in top income groups, OWID.svg 850 × 600; 12 KB
-

-

-

-
 Share with alcohol or drug use disorders, men vs. women, OWID.svg 850 × 600; 43 KB
-
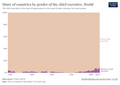 Share-of-countries-by-gender-of-the-chief-executive.png 3,400 × 2,400; 355 KB
-
 Suicide death rates by sex, OWID.svg 850 × 600; 9 KB
-
 The gender wage ratio in different income percentiles, OWID.svg 850 × 600; 6 KB
-

-
 Time allocation in Finland, by sex, OWID.svg 850 × 600; 7 KB
-
 Time spent in domestic work, female vs. male, OWID.svg 850 × 600; 8 KB
-
 Time spent on 'other activities', per day, men vs women, OWID.svg 850 × 600; 14 KB
-
 Time spent on activities in an average day, females, OWID.svg 850 × 600; 9 KB
-
 Time spent on activities in an average day, males, OWID.svg 850 × 600; 9 KB
-

-
 Time spent on domestic work, per day, men vs women, OWID.svg 850 × 600; 8 KB
-

-

-
 Time spent on leisure, per day, men vs women, OWID.svg 850 × 600; 13 KB
-

-
 Time spent on paid work or study, per day, men vs women, OWID.svg 850 × 600; 13 KB
-
 Time spent on personal care, per day, men vs women, OWID.svg 850 × 600; 13 KB
-
 Time spent on unpaid work, per day, men vs women, OWID.svg 850 × 600; 14 KB
-
 Time spent sleeping, per day, men vs women, OWID.svg 850 × 600; 8 KB
-
 Total Fertility Rate and Labor Force Participation Rate.png 1,452 × 1,024; 322 KB
-
 Total net enrollment rate in primary education by sex, OWID.svg 850 × 600; 33 KB
-
 Unadjusted gender gap in average hourly wages, OWID.svg 850 × 600; 7 KB
-
 Unadjusted gender gap in median earnings, OWID.svg 850 × 600; 17 KB
-
 Unadjusted gender wage gap including unemployed, OWID.svg 850 × 600; 7 KB
-
 Unemployment rate of males vs. females, OWID.svg 850 × 600; 44 KB
-
 Unemployment rate, women vs men, OWID.svg 850 × 600; 37 KB
-

-

-
-
-
 Women in informal employment as share of female employment, OWID.svg 850 × 600; 11 KB
-

-
 Women participating in decisionmaking vs fertility, OWID.svg 850 × 600; 16 KB
-
 Women's educational attainment vs. fertility, OWID.svg 850 × 600; 32 KB
-

-
 Women-among-the-population-living-with-hiv.png 3,400 × 2,400; 779 KB


,_OWID.svg)


,_OWID.svg)

),_OWID.svg)


),_OWID.svg)


.png)


_in_education,_OWID.svg)


,_OWID.svg)

_in_employment_by_sex,_OWID.svg)


),_OWID.svg)
_(Chinese_and_South_Korean_only),_OWID.svg)


