Category:Oscillograms
Jump to navigation
Jump to search
English: For screen dumps or photos where the main motive is an oscillogram. An oscillogram is a graph of an electrical signal traced by an oscilloscope, typically on a screen with a grid, and can be either a time plot or a X-Y plot
image generated by an oscilloscope | |||||
| Upload media | |||||
| Subclass of | |||||
|---|---|---|---|---|---|
| |||||
Subcategories
This category has the following 5 subcategories, out of 5 total.
Media in category "Oscillograms"
The following 200 files are in this category, out of 205 total.
(previous page) (next page)-
1996--Original photo of oscilloscope trace (5940300289).jpg 853 × 671; 361 KB
-
1tt.jpg 2,560 × 1,440; 675 KB
-
3rd orderHarmonics.png 1,592 × 502; 130 KB
-
880Hz sine wave.png 1,897 × 872; 475 KB
-
A Major.png 1,346 × 340; 376 KB
-
A Minor Graph.png 1,070 × 360; 329 KB
-
A Minor.png 1,128 × 376; 95 KB
-
A220.PNG 590 × 396; 18 KB
-
A440Hz.PNG 585 × 390; 13 KB
-
AC graph on oscilloscope.PNG 640 × 443; 333 KB
-
AF oscillator signal.JPG 2,300 × 1,800; 601 KB
-
AI Mk.IV radar display E(MOS)1448.jpg 800 × 610; 40 KB
-
Amc5H.jpg 584 × 439; 13 KB
-
Amplifier gain shown on oscilloscope.JPG 3,648 × 2,736; 3.97 MB
-
Analiza cech suprasegmentalnych języka polskiego Fig.7.1 (p.63).jpg 1,466 × 946; 125 KB
-
Annotated trace of DMX-512 signal.png 1,200 × 808; 87 KB
-
APC Back-UPS 550 Uninterruptible Power Supply Output Waveform.jpg 1,600 × 960; 472 KB
-
Arduino Mixed Sine Waves on DSO Quad (6312726999).jpg 2,592 × 1,936; 1.17 MB
-
Ausgangsspanung Trapezwechselrichter.JPG 938 × 748; 207 KB
-
BackEMFWaveform.png 800 × 594; 249 KB
-
Bittmotif2-full.jpg 637 × 441; 38 KB
-
Bouncy Switch.png 512 × 289; 6 KB
-
Break arc on osciloscope.jpg 640 × 233; 34 KB
-
C+B.gif 548 × 123; 4 KB
-
C+G.gif 243 × 208; 2 KB
-
C-F.gif 267 × 117; 2 KB
-
C262.PNG 583 × 390; 14 KB
-
C3 131 Hz oscillogram.png 1,090 × 569; 38 KB
-
C5 523 Hz oscillogram.png 1,094 × 572; 53 KB
-
Card24HeatFail sm.JPG 640 × 480; 259 KB
-
CFL Negative Power.png 1,024 × 481; 66 KB
-
CFL Positive power.png 1,024 × 481; 66 KB
-
Chord minor.png 1,034 × 382; 10 KB
-
Clipping 1KHz 10V DIV clip A 5ohms-1-.jpg 544 × 408; 75 KB
-
Clipping Signal 1KHz 10V on Oscilloscope.jpg 362 × 302; 36 KB
-
Component tester diode anti-parallel.png 1,280 × 947; 928 KB
-
Component tester diode reverse.png 1,280 × 1,014; 1.03 MB
-
Component tester diode serial.png 1,280 × 1,001; 961 KB
-
Component tester diode.png 1,280 × 972; 930 KB
-
Component tester short circuit.png 1,280 × 1,028; 1.09 MB
-
CROyoffset.gif 821 × 480; 190 KB
-
D294.PNG 585 × 393; 31 KB
-
DC graph on oscilloscope.PNG 640 × 307; 277 KB
-
DC graph.PNG 640 × 960; 570 KB
-
Decodage I²C I2C Lecroy.JPG 800 × 600; 94 KB
-
Digiscope plot.PNG 640 × 480; 12 KB
-
Digital oscilloscope.jpg 945 × 800; 170 KB
-
Dimmer 60 volts.png 643 × 296; 12 KB
-
Dual-Add Mode.svg 453 × 200; 305 KB
-
E3268 - DPLA - eec464b17045d7b2df94ab14950b0745.jpg 5,526 × 3,750; 6.27 MB
-
E3284 - DPLA - 463410a50dd7b7c6cb4de4b4b2e5ff4e.jpg 5,246 × 3,892; 7.58 MB
-
E3298 - DPLA - 7a60c37d82bc675ca249394e436367c7.jpg 5,205 × 3,717; 6.38 MB
-
E3299 - DPLA - b9cd64f6be736e49c3a9553371049be3.jpg 5,012 × 3,672; 6.83 MB
-
E330.PNG 585 × 396; 26 KB
-
EDGE Current SPAD.png 1,074 × 692; 182 KB
-
Energiesparlampe Sinusspannung.JPG 1,186 × 394; 136 KB
-
Energiesparlampe Trapezspannung.JPG 1,154 × 362; 112 KB
-
Engineering Design.jpg 648 × 484; 37 KB
-
Example ARINC 429 decode.jpg 907 × 402; 58 KB
-
Eye pattern example.png 1,155 × 559; 106 KB
-
F349.PNG 585 × 390; 32 KB
-
First radar return from the Moon - Project Diana 1946.jpg 340 × 272; 34 KB
-
FlybackWaveform.gif 800 × 598; 266 KB
-
G392.PNG 585 × 394; 11 KB
-
Half-wave rectifier waveform.png 658 × 420; 7 KB
-
HD.6D.679 (12001274686).jpg 3,200 × 2,563; 1.05 MB
-
HD.6D.679 (13955524631).jpg 288 × 232; 14 KB
-
HDO4000 Sketch Sine Signal + Zoom.png 910 × 660; 142 KB
-
I2C wiki.PNG 1,922 × 641; 512 KB
-
Imagedixneuf.PNG 584 × 418; 66 KB
-
Imagedixseipt.PNG 540 × 391; 62 KB
-
Imagevinght.PNG 582 × 423; 72 KB
-
Increase-in-local-protein-concentration-by-field-inversion-gel-electrophoresis-1477-5956-5-18-S5.ogv 5.4 s, 240 × 176; 268 KB
-
Ingresso-Uscita filtro RC (2).jpg 4,000 × 3,000; 455 KB
-
Ingresso-Uscita filtro RC.jpg 4,000 × 3,000; 304 KB
-
Inverter output of an APC Smart-UPS SMT1500I.jpg 1,024 × 768; 331 KB
-
Inverting Amplifier Signal Clipping.png 658 × 420; 9 KB
-
Ir rc5 code demodulated.jpg 650 × 500; 78 KB
-
Joule thief waveform.jpg 4,393 × 3,292; 3.25 MB
-
K293КП3А при токе светодиода 1мА, 100Гц.jpg 1,600 × 890; 314 KB
-
K293КП3А при токе светодиода 2мА, 100Гц.jpg 1,600 × 901; 301 KB
-
K293КП3А при токе светодиода 2мА, 300Гц.jpg 1,600 × 890; 348 KB
-
KennlinieDiode resized.jpg 480 × 360; 22 KB
-
KennlinieKondensator resized.jpg 480 × 360; 25 KB
-
KFC DSCN6223.jpg 640 × 480; 126 KB
-
Klon centaur input signal.png 494 × 385; 134 KB
-
Klon centaur output signal.png 452 × 364; 126 KB
-
Lamp inrush current.png 800 × 480; 31 KB
-
LEDS 2 ANTIPARALLEL CIRCUIT RIGOL OSCILLOSCOPE.jpg 800 × 480; 104 KB
-
Lignes video.jpg 596 × 329; 51 KB
-
Line21ClosedCaption.png 800 × 480; 23 KB
-
Local-datasignal.png 503 × 596; 50 KB
-
Measure Delay of an Not Scope 1.svg 156 × 120; 12 KB
-
Measure Delay of an Not Scope 2.svg 156 × 120; 11 KB
-
Middle C, or 262 hertz, on a virtual oscilloscope.png 1,100 × 574; 43 KB
-
Modified sine wave inverter waveform.png 800 × 480; 16 KB
-
Motor Drive Waveform (38826359561).jpg 3,069 × 2,256; 3.72 MB
-
Opana SCR-270 radar display Dec 7, 1941.jpeg 583 × 752; 88 KB
-
Oscili Het 1.jpg 3,264 × 2,448; 2.25 MB
-
Oscilli AC hum on sound leak.jpg 3,264 × 2,448; 2.32 MB
-
Oscilli AM Beam.jpg 3,264 × 2,448; 2.32 MB
-
Oscilli Noise Leak.jpg 3,264 × 2,448; 2.42 MB
-
Oscilli Sep Time.jpg 3,264 × 2,448; 2.17 MB
-
Oscilli Tunnle.jpg 3,264 × 2,448; 2.06 MB
-
Oscillogram AM mismatch.JPG 780 × 780; 193 KB
-
Oscillogram AM OK 01.JPG 780 × 780; 192 KB
-
Oscillogram AM too high.JPG 780 × 780; 193 KB
-
Oscillogram AM too low.JPG 780 × 780; 194 KB
-
Oscillogram and spectrogram of Leptodactylus apepyta.png 3,240 × 1,954; 476 KB
-
Oscillogram shown on laptop screen (cropped).jpeg 2,414 × 2,737; 1.33 MB
-
Oscillogram shown on laptop screen.jpeg 3,024 × 4,032; 2.15 MB
-
Oscillogram SSB different amplitudes.JPG 780 × 780; 147 KB
-
Oscillogram SSB OK.JPG 780 × 780; 161 KB
-
Oscillogram SSB overdriven.JPG 780 × 780; 156 KB
-
Oscillogram SSB wrong bias.JPG 780 × 780; 152 KB
-
Oscillograph. Wellcome M0014862.jpg 3,858 × 2,894; 4.96 MB
-
Oscillographe courant alternatif symétrique.svg 1,000 × 800; 44 KB
-
Oscillographe courant bidirectionnel.svg 1,000 × 800; 44 KB
-
Oscillographe courant unidirectionnel.svg 1,000 × 800; 44 KB
-
Oscillographe tension carrée positive.svg 1,000 × 800; 43 KB
-
Oscillographe tension continue positive.svg 1,000 × 800; 43 KB
-
Oscillographe tension dent de scie négative.svg 1,000 × 800; 44 KB
-
Oscillographe tension impulsion positive.svg 1,000 × 800; 43 KB
-
Oscillographe tension sinusoïde.svg 1,000 × 800; 44 KB
-
Oscillographe tension triangulaire positif.svg 1,000 × 800; 43 KB
-
Oscillographe tension triangulaire.svg 1,000 × 800; 44 KB
-
Oscillometric Blood Pressure Waveform.jpg 1,025 × 576; 153 KB
-
Oscilloscope screenshot of Ethernet transmission.jpg 639 × 478; 117 KB
-
Oscilloscope showing output of transformer.jpg 2,560 × 1,440; 673 KB
-
Oscilloscope traces (5941055080).jpg 825 × 670; 311 KB
-
Oscilloscope Triangle Wave.jpg 1,972 × 1,598; 1.6 MB
-
Oscilloscope with a Doppler radar signal.jpg 1,800 × 1,212; 241 KB
-
Oscilloscopeabc.jpg 4,608 × 3,456; 4.56 MB
-
Oscilloscopeabcd.jpg 4,608 × 3,456; 4.66 MB
-
Oscilloscopeabcde.jpg 4,608 × 3,456; 4.82 MB
-
Oscilloscopeabcdef.jpg 4,608 × 3,456; 4.69 MB
-
Oscilloscopeabcdefg.jpg 4,608 × 3,456; 4.77 MB
-
Oscil·lograma.jpg 608 × 406; 80 KB
-
Oszi Geräusch.svg 310 × 250; 22 KB
-
Oszi Klang.svg 310 × 250; 22 KB
-
Oszi Knall.svg 310 × 250; 22 KB
-
Oszi Ton.svg 310 × 250; 23 KB
-
Oszi Trig.PNG 709 × 274; 22 KB
-
Oszi Unterabtast.PNG 605 × 236; 20 KB
-
Out put of adrino.jpg 2,560 × 1,440; 452 KB
-
Out put of black box.jpg 2,560 × 1,440; 441 KB
-
PCI-signaling-graph.png 4,788 × 2,944; 437 KB
-
Peakpeak.jpg 640 × 480; 45 KB
-
Peregrine soliton in optics.png 272 × 333; 11 KB
-
PICInterfaceMultiplex CH4 Massimo ConfrontoMinimo.png 2,048 × 1,791; 20 KB
-
PICInterfaceMultiplex CH4 Massimo MisuraMassimo.png 2,048 × 1,791; 21 KB
-
PICInterfaceMultiplex CH4 Massimo Tutti 7 Canali.png 2,048 × 1,791; 21 KB
-
PICInterfaceMultiplex CH4 Minimo MisuraMinimo.png 2,048 × 1,790; 20 KB
-
PICInterfaceMultiplex CH4 Minimo Tutti 7 Canali.png 2,048 × 1,791; 21 KB
-
Pwm signal.png 508 × 405; 4 KB
-
Radar signal echo from the moon (6789570806).jpg 580 × 609; 72 KB
-
RAV4 Tach 2000rpm.JPG 1,037 × 778; 132 KB
-
RAV4 Tach 3000rpm.JPG 1,037 × 778; 127 KB
-
RC PULSE.png 320 × 240; 8 KB
-
Rezim chop osciloskopu.png 236 × 190; 2 KB
-
Rumorebiancodtcx.gif 600 × 338; 4.22 MB
-
Saturable reactor measured.png 400 × 470; 12 KB
-
Scope-screen.png 471 × 301; 11 KB
-
Scopesinus.PNG 395 × 322; 15 KB
-
Screen Shot 2015-11-24 at 7.07.12 PM.png 1,592 × 502; 130 KB
-
Segnale modulato in ampiezza.jpg 1,600 × 1,200; 144 KB
-
Sein condens.jpg 123 × 90; 2 KB
-
Sein erreg.jpg 117 × 94; 2 KB
-
Sein trans.jpg 129 × 98; 3 KB
-
Simulated scope screen 640x480 7 2000.png 640 × 480; 61 KB
-
Sin220.gif 504 × 285; 19 KB
-
Sine wave 10 kHz displayed on analog oscilloscope.jpg 1,333 × 1,076; 322 KB
-
Sinibp.gif 504 × 285; 20 KB
-
Sinusoidal waves formed by a 4.55V source.jpg 4,320 × 2,432; 2.34 MB
-
Sn2-5.jpg 714 × 646; 181 KB
-
Softkey.jpg 869 × 562; 56 KB
-
Spectrogram and oscillogram of Craugastor yucatanensis advertisement call.jpg 1,512 × 720; 231 KB
-
Spettrogramma sinusoide 880 Hz.png 1,889 × 649; 778 KB
-
Stromwandler 2.jpg 1,600 × 1,200; 363 KB
-
Stromwandler 3.jpg 1,600 × 1,200; 93 KB
-
Stromwandler xy.jpg 1,600 × 1,200; 78 KB
-
Switch bounce.JPG 2,592 × 1,944; 2.14 MB
-
Tastenprellen01.png 512 × 275; 5 KB
-
TDR Step Same Baseline.JPG 2,586 × 2,188; 1.31 MB
-
TDR trace of cable terminationed with its characteristic impedance.jpg 1,125 × 847; 182 KB
-
TDR trace of cable with a capacitor termination.jpg 1,201 × 889; 218 KB
-
TDR trace of cable with a short circuit termination.JPG 1,195 × 889; 206 KB
-
TDR trace of cable with cable terminated on an oscilloscope.JPG 1,175 × 880; 182 KB
-
TDR trace of cable with open termination.JPG 1,196 × 875; 181 KB
-
Tensione ingresso-uscita di un amplificatore non invertente.jpg 4,000 × 3,000; 3.45 MB
-
Test2 15.jpg 1,520 × 2,688; 1.87 MB
-
Testing a piezoelectric crystal for output.JPG 3,648 × 2,736; 4 MB
-
The oscillograph - its construction and uses (1903) (14596454158).jpg 2,116 × 2,969; 325 KB
-
Trafo diff 1.jpg 500 × 375; 16 KB
-
Trafo diff 2.jpg 500 × 375; 16 KB
-
Tri Level Sync.JPG 1,632 × 1,224; 489 KB
-
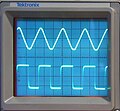
Triangular wave and square wave on oscilloscope screen (cropped).jpg 1,139 × 939; 335 KB
-
Triangular wave and square wave on oscilloscope screen.jpg 1,498 × 1,382; 561 KB


