Category:Molecular electrical potential surfaces
Jump to navigation
Jump to search
| Upload media | |||||
| Subclass of |
| ||||
|---|---|---|---|---|---|
| |||||
See also Category:Molecular orbitals
Media in category "Molecular electrical potential surfaces"
The following 200 files are in this category, out of 213 total.
(previous page) (next page)-
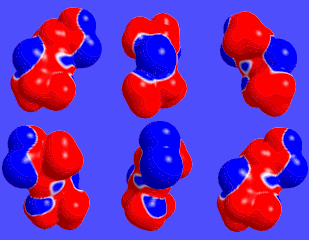
(R)-Thalidomide model TSC.png 4,097 × 2,357; 1.15 MB
-
(S)-Thalidomide model TSC.png 3,359 × 1,852; 1.14 MB
-
1FIW ESP Map.png 4,418 × 2,862; 7.07 MB
-
4-Chloromercuribenzoic-acid-3D-elpot-transparent.png 1,032 × 604; 339 KB
-
4-Nitrobenzoic-acid-elpot-3D-vdW.png 966 × 624; 426 KB
-
6-APA Mulliken charges surface.gif 815 × 675; 6.18 MB
-
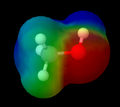
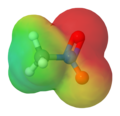
Acetone-elpot.png 664 × 626; 182 KB
-
Aluminium-hydroxide-elpot-transparent-3D-balls.png 722 × 706; 182 KB
-
Amino-radical-3D-elpot.png 760 × 656; 234 KB
-
Ammonia-15N-elpot-transparent-3D-balls.png 618 × 578; 177 KB
-
Ammonia-borane-elpot-transparent-3D-balls.png 802 × 720; 238 KB
-
Ammonia-elpot-transparent-3D-balls-A.png 1,073 × 1,100; 275 KB
-
Ammonia-elpot-transparent-3D-balls-B.png 1,100 × 964; 265 KB
-
Ampicillin total charge surface.gif 680 × 816; 6.39 MB
-
Astatine-elpot-transparent-3D-balls.png 896 × 744; 139 KB
-
Auranofin-elpot-transparent-3D-balls.png 860 × 572; 366 KB
-
Beispiele zur Betrachtung der Polarität der Bindungen mit MEP.svg 1,407 × 525; 575 KB
-
Benzene Electrostatics.jpg 460 × 472; 37 KB
-
Benzene-3D-potential.png 753 × 768; 296 KB
-
Benzonitrile-elpot-transparent-3D-balls.png 694 × 606; 274 KB
-
Benzyne-3D-potential.png 704 × 620; 217 KB
-
Beryllium-chloride-monomer-elpot-transparent-3D-balls.png 1,154 × 638; 241 KB
-
Beryllium-fluoride-elpot-transparent-3D-balls.png 1,084 × 716; 154 KB
-
Bifluoride-elpot-3D-vdW.png 1,029 × 600; 130 KB
-
Borane-elpot-transparent-3D-balls.png 694 × 712; 154 KB
-
Borazine-elpot-3D-vdW.png 725 × 748; 238 KB
-
Borginson.png 586 × 560; 112 KB
-
Boric-acid-acidity-elpot-3D-vdW.png 896 × 642; 123 KB
-
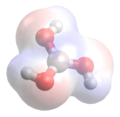
Boric-acid-elpot-transparent-3D-sticks.png 794 × 700; 213 KB
-
Boron-trifluoride-elpot-3D-vdW.png 1,100 × 1,032; 306 KB
-
Bromine-elpot-transparent-3D-balls.png 888 × 724; 138 KB
-
Bupropion 3D structure with electrostatic potential.png 1,168 × 873; 703 KB
-
Butanone-3D-elpot.png 784 × 610; 223 KB
-
Caffeine total charge surface.gif 757 × 733; 6.47 MB
-
Carbon-dioxide-elpot.png 996 × 658; 336 KB
-
Carbon-monoxide-elpot.png 914 × 711; 247 KB
-
Carbon-subnitride-3D-elpot-lucent.png 1,388 × 636; 332 KB
-
Carbon-suboxide-elpot-3D-vdW.png 1,238 × 630; 327 KB
-
Carbonyl-bromide-elpot-3D-vdW.png 696 × 606; 175 KB
-
Carbonyl-fluoride-3D-potential.png 702 × 700; 221 KB
-
Carbonyl-sulfide-elpot-transparent-3D-balls.png 1,134 × 670; 260 KB
-
Caro's-acid-3D-elpot.png 764 × 632; 206 KB
-
Chemical-potentials-for-AC-N-O-H-atoms.jpg 788 × 709; 134 KB
-
Chlorine-dioxide-elpot.png 1,100 × 847; 374 KB
-
Chlorine-elpot-transparent-3D-balls.png 892 × 744; 144 KB
-
Chlorine-monofluoride-elpot-transparent-3D-balls.png 942 × 688; 189 KB
-
Chlorine-monoxide-3D-elpot.png 844 × 634; 174 KB
-
Chlorine-trifluoride-elpot.png 1,100 × 865; 364 KB
-
Cinnamaldehyde-3D-elpot.png 1,022 × 687; 319 KB
-
Common-Force-Field-Thermodynamics-of-Cholesterol-207287.f1.ogv 14 s, 720 × 768; 2.39 MB
-
Copper(II)-nitrate-monomer-elpot-transparent-3D-balls.png 1,126 × 686; 250 KB
-
Cyanic-acid-elpot-transparent-3D-balls.png 864 × 588; 798 KB
-
Cyano-radical-elpot-transparent-3D-balls.png 770 × 616; 212 KB
-
Cyanogen-chloride-3D-elpot.png 1,052 × 634; 290 KB
-
Cyanogen-elpot-transparent-3D-balls.png 1,176 × 640; 328 KB
-
Cyclooctatetraenide-elpot-3D-vdW.png 796 × 758; 256 KB
-
Cyclopentadienide-elpot-3D-vdW.png 769 × 761; 147 KB
-
D-Ala-D-ala total charge surface.gif 632 × 737; 5.47 MB
-
D-glucose-chain-elpot-3D-vdW.png 1,078 × 606; 359 KB
-
D-glucose-chain-elpot-transparent-3D-balls.png 1,082 × 608; 445 KB
-
Darstellung polarer Bindungen.svg 1,575 × 540; 272 KB
-
Delphi-peptide-elpot-transparent-3D-sticks.png 1,111 × 787; 124 KB
-
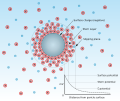
Diagram of zeta potential and slipping plane.svg 3,611 × 3,033; 513 KB
-
Dialane-elpot-transparent-3D-balls.png 1,136 × 682; 320 KB
-
Diborane-elpot-transparent-3D-balls.png 1,082 × 852; 523 KB
-
Dichloroacetylene-elpot-3D-vdW.png 1,348 × 648; 358 KB
-
Dichromium Molecule.png 978 × 618; 275 KB
-
Difluorosilane-elpot-transparent-3D-balls.png 564 × 588; 200 KB
-
Dimethyl-ether-elpot-transparent-3D-sticks.png 824 × 626; 299 KB
-
Dimethyl-peroxide-elpot-transparent-3D-sticks.png 1,014 × 644; 406 KB
-
Diphosphorus-3D-elpot.png 888 × 638; 200 KB
-
Dipoli acido fluoridrico.png 747 × 600; 140 KB
-
Dipoli acqua.png 712 × 599; 158 KB
-
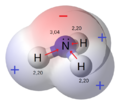
Dipoli ammoniaca.png 684 × 599; 164 KB
-
Disiloxane-3D-elpot-transparent.png 860 × 584; 337 KB
-
Disulfur-elpot-transparent-3D-balls.png 834 × 728; 114 KB
-
DMSO-elpot.png 1,100 × 964; 426 KB
-
Electrostatic potential around corrugated MoS2 monolayer solvated by water.png 4,828 × 2,461; 735 KB
-
Electrostatic potential heterocycles.tif 648 × 288; 1.15 MB
-
Electrostatic potential map benzyne.jpg 201 × 119; 10 KB
-
Electrostatic potential maps of aromatic amino acids.png 1,307 × 612; 251 KB
-
Electrostatic Potential.jpg 439 × 110; 8 KB
-
Elektrostatisches Potential - Oberfläche von superelektrophilen Anionen.jpg 4,338 × 1,155; 287 KB
-
Ethanol-3D-elpot-lucent.png 712 × 616; 250 KB
-
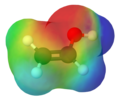
Ethenol-elpot-transparent-3D-balls.png 756 × 638; 267 KB
-
Ethyl-acetate-3D-elpot.png 908 × 596; 284 KB
-
Ethylene-dione-3D-elpot.png 1,158 × 700; 296 KB
-
Ethylene-oxide-3D-elpot-transparent.png 1,002 × 866; 397 KB
-
Ethynyl-radical-elpot-transparent-3D-balls.png 874 × 638; 141 KB
-
Fluorine-3D-elpot-lucent.png 878 × 618; 181 KB
-
Fluoroantimonic-acid-3D-elpot.png 844 × 632; 116 KB
-
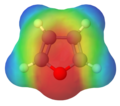
Furan-3D-elpot-transparent.png 664 × 584; 251 KB
-
Gallic acid ESP.png 641 × 747; 213 KB
-
HX-polarity-montage-3D-balls-horizontal.png 2,150 × 602; 255 KB
-
HX-polarity-montage-3D-balls.png 823 × 2,200; 340 KB
-
Hydrazine-elpot-transparent-3D-balls.png 770 × 592; 257 KB
-
Hydrogen-astatide-elpot-transparent-3D-balls.svg 1,125 × 995; 11 KB
-
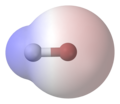
Hydrogen-bromide-elpot-transparent-3D-balls.png 1,100 × 952; 177 KB
-
Hydrogen-chloride-elpot-transparent-3D-balls.png 1,100 × 936; 180 KB
-
Hydrogen-cyanide-3D-elpot.png 1,322 × 984; 424 KB
-
Hydrogen-elpot-transparent-3D-balls.png 1,100 × 1,009; 160 KB
-
Hydrogen-fluoride-elpot-transparent-3D-balls.png 1,100 × 883; 182 KB
-
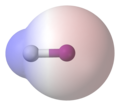
Hydrogen-iodide-elpot-transparent-3D-balls.png 1,100 × 972; 178 KB
-
Hydrogen-isocyanide-elpot-transparent-3D-balls.png 1,020 × 696; 233 KB
-
Hydrogen-peroxide-elpot-transparent-3D-sticks.png 688 × 554; 204 KB
-
Hydrogen-selenide-elpot-transparent-3D-balls.png 618 × 610; 154 KB
-
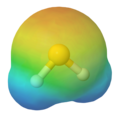
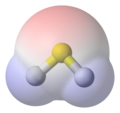
Hydrogen-sulfide-elpot-transparent-3D-balls.png 1,100 × 1,038; 247 KB
-
Hydrogen-sulfoxide-3D-elpot.png 960 × 718; 209 KB
-
Hydrogen-thioperoxide-3D-elpot.png 696 × 592; 228 KB
-
Hydromagnesium-isocyanide-3D-elpot.png 1,146 × 652; 265 KB
-
Hydroxonium-3D-elpot.png 734 × 729; 202 KB
-
Hydroxylamine-3D-elpot.png 702 × 578; 231 KB
-
Induced-Fit-in-Protein-Multimerization-The-HFBI-Case-pcbi.1005202.s005.ogv 4.0 s, 1,412 × 1,030; 3.57 MB
-
Iodine-elpot-transparent-3D-balls.png 888 × 724; 133 KB
-
Iodosilane-elpot-3D-vdW.png 838 × 598; 261 KB
-
Iron(III)-chloride-vdW-3D-balls.png 1,100 × 1,036; 463 KB
-
Iron-tetracarbonyl-hydride-anion-elpot-3D-vdW.png 648 × 580; 138 KB
-
Isocyanogen-3D-potential.png 1,244 × 688; 515 KB
-
L-carnitina-densidad-electronica.png 1,600 × 1,038; 658 KB
-
L-Glucose-elpot-transparent-3D-balls.png 766 × 628; 333 KB
-
Lawesson's-reagent-elpot-3D-balls.png 1,100 × 616; 366 KB
-
Lithioferrocene-3D-elpot.png 914 × 692; 369 KB
-
Lithium-fluoride-elpot-3D-balls.png 1,100 × 780; 150 KB
-
Magnesium-monohydride-3D-elpot.png 834 × 618; 199 KB
-
Manganese-heptoxide-elpot-3D-balls.png 942 × 724; 417 KB
-
MEP transparent von Acrylnitril.png 797 × 756; 222 KB
-
MEP transparent von Methylacrylsäuremethacrylat.png 933 × 859; 326 KB
-
MEP transparent von PVC.png 552 × 571; 158 KB
-
MEP von Anti-Dichlorethen.png 846 × 814; 216 KB
-
MEP von Decanol.png 832 × 277; 112 KB
-
MEP von Ethanol.png 228 × 203; 25 KB
-
MEP von Propanol.png 804 × 618; 195 KB
-
MEP von Syn-Dichlorethen.png 902 × 699; 204 KB
-
Methan-Molekül und die MEP.png 486 × 250; 41 KB
-
Methane-3D-elpot.png 714 × 672; 242 KB
-
Methoxyethane-3D-elpot.png 922 × 614; 323 KB
-
Methyl-nitrite-elpot-transparent-3D-balls.png 1,070 × 728; 256 KB
-
Nanocar-elpot-transparent-3D-balls.jpg 4,000 × 2,445; 2.38 MB
-
Naphthalene-3D-elpot.png 802 × 640; 286 KB
-
Neonium-elpot-transparent-3D-balls.png 894 × 696; 184 KB
-
Nickel-tetracarbonyl-3D-elpot.png 646 × 680; 182 KB
-
Nitrate-elpot-transparent-3D-balls.png 1,100 × 1,044; 485 KB
-
Nitrate-ion-elpot.png 751 × 714; 64 KB
-
Nitric-oxide-3D-elpot.png 786 × 612; 200 KB
-
Nitroethylene-elpot-transparent-3D-balls.png 918 × 714; 244 KB
-
Nitrogen-dioxide-elpot-transparent-3D-balls.png 934 × 710; 216 KB
-
Nitrogen-elpot-transparent-3D-balls.png 820 × 712; 111 KB
-
Nitromethane-3D-elpot-lucent.png 662 × 640; 203 KB
-
Nitrous-oxide-3D-elpot.png 986 × 612; 326 KB
-
Nitroxyl-3D-elpot.png 940 × 706; 214 KB
-
Orthotitanic-acid-elpot-transparent-3D-sticks.png 822 × 816; 442 KB
-
Oxygen-difluoride-elpot.png 858 × 674; 209 KB
-
Oxygen-elpot-transparent-3D-balls.png 858 × 746; 120 KB
-
Oxywater-elpot-transparent-3D-balls.png 874 × 690; 208 KB
-
Ozone-elpot-3D-vdW.png 994 × 758; 183 KB
-
P7H3-elpot-transparent-3D-balls.png 634 × 604; 207 KB
-
Paracetamol Electron Map.png 1,072 × 1,000; 160 KB
-
Paracetamol-potential.png 876 × 610; 371 KB
-
Penicillin G Electrostatic Surfaces.jpg 586 × 487; 158 KB
-
Pentafulvalene-3D-elpot.png 898 × 628; 329 KB
-
Peroxydisulfuric-acid-3D-elpot-lucent.png 928 × 680; 451 KB
-
Phenol-elpot-3D-vdW.png 663 × 752; 195 KB
-
Phenol-elpot.png 514 × 729; 125 KB
-
Phenylmercuric-nitrate-3D-elpot-lucent.png 1,108 × 622; 417 KB
-
Phenylsilver-3D-elpot.png 754 × 624; 256 KB
-
Phosgene-potential.png 840 × 750; 310 KB
-
Phosphine-elpot-transparent-3D-balls.png 1,100 × 1,082; 248 KB
-
Phosphole-3D-elpot-lucent.png 648 × 630; 242 KB
-
Phosphorane-elpot-transparent-3D-balls.png 672 × 704; 227 KB
-
Phosphoric-acid-potential.png 928 × 1,000; 408 KB
-
Phosphorothioic-chloride-difluoride-3D-elpot-lucent.png 598 × 646; 147 KB
-
Phosphorus-monoxide-3D-elpot.png 836 × 652; 202 KB
-
Phosphorus-nitride-3D-elpot.png 890 × 700; 361 KB
-
Phosphorus-triiodide-3D-elpot.png 666 × 538; 172 KB
-
Propyne-3D-elpot.png 1,028 × 694; 486 KB
-
Pyrrole-3D-elpot.png 640 × 602; 227 KB
-
Realgar-3D-elpot.png 732 × 626; 235 KB
-
Remdesivir molecule.png 456 × 393; 718 KB
-
Selenic-acid-elpot-transparent-3D-balls.png 640 × 606; 212 KB
-
Serotonin Electron Map.tiff 1,184 × 994; 275 KB
-
Silan-Molekül und die MEP.png 539 × 250; 81 KB
-
Simvastatin with electrostatic potential mapped to molecular surface.png 816 × 840; 256 KB
-
Sodium-gold(I)-thiosulfate-elpot-transparent-3D-sticks.png 1,540 × 1,124; 365 KB
-
Styrene-elpot-3D-vdW.png 810 × 584; 255 KB
-
Sucrose-3D-elpot.png 778 × 586; 364 KB
-
Sulfur-dioxide-elpot.png 831 × 668; 285 KB
-
Sulfur-monoxide-elpot.png 1,014 × 722; 214 KB
-
Sulfuric-acid-elpot.png 636 × 580; 269 KB
-
Tannic acid ESP.png 790 × 754; 382 KB
-
Taxol total charge surface.gif 796 × 697; 19.8 MB
-
Tert-Butyl-acetate-3D-elpot-transparent.png 772 × 594; 300 KB
-
The-molecular-electrostatic-potential-of-cefuroxime-axetil.jpg 600 × 318; 78 KB
-
Theobromine total charge surface.gif 986 × 974; 8.47 MB
-
Thiazyl-trifluoride-3D-elpot-transparent.png 592 × 588; 202 KB
-
Thiirane-elpot-transparent-3D-balls.png 956 × 978; 436 KB
-
Thiocyanate-elpot.png 1,071 × 724; 340 KB
-
Thiophenol-elpot.png 812 × 626; 311 KB
-
Thiophosphoryl-dibromide-chloride-3D-elpot.png 624 × 652; 268 KB


