Category:Molecular and cellular biology
Jump to navigation
Jump to search
English: Remember to add images related to Molecular and cellular biology to the Molecular and cellular biology gallery.
Subcategories
This category has the following 3 subcategories, out of 3 total.
C
Pages in category "Molecular and cellular biology"
This category contains only the following page.
Media in category "Molecular and cellular biology"
The following 141 files are in this category, out of 141 total.
-
 20110113-Co-Immunoprecipitation.svg 904 × 660; 31 KB
-
 Array comparative genomic hybridization.svg 600 × 450; 126 KB
-
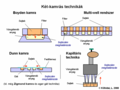
 Blot biology.svg 650 × 500; 20 KB
-
 C5a-3D.png 960 × 720; 38 KB
-
 Central Dogma of Molecular Biochemistry with Enzymes.jpg 318 × 389; 70 KB
-
 Chemokinesis-en.png 960 × 720; 107 KB
-
 Chemokinesis-es.png 960 × 720; 73 KB
-
 Chemokinesis-hu.png 960 × 720; 73 KB
-
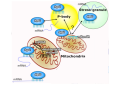
 Chtx-Aptotx-Ita.png 960 × 720; 29 KB
-
 Chtx-Asy-Ita1.png 960 × 720; 64 KB
-
 Chtx-Asy-Ita2.png 960 × 720; 145 KB
-
 Chtx-Asy-Ita3.png 960 × 720; 105 KB
-
 Chtx-Attr-Rep-Ita.png 960 × 720; 49 KB
-
 Chtx-AttrRep-esp.png 960 × 720; 24 KB
-
 Chtx-AttrRep-fr.png 960 × 720; 24 KB
-
 Chtx-AttrRep-hu.png 960 × 720; 25 KB
-
 Chtx-Deu10.png 960 × 720; 22 KB
-
 Chtx-Deu2.png 960 × 720; 81 KB
-
 Chtx-Deu3.png 960 × 720; 119 KB
-
 Chtx-Deu6.png 960 × 720; 81 KB
-
 Chtx-Deu7.png 960 × 720; 29 KB
-
 Chtx-Ita1.png 960 × 720; 162 KB
-
 Chtx-Ita10.png 960 × 720; 22 KB
-
 Chtx-Ita11.png 960 × 720; 9 KB
-
 Chtx-Ita2.png 960 × 720; 70 KB
-
 Chtx-Ita3.png 960 × 720; 116 KB
-
 Chtx-Ita4.png 960 × 720; 35 KB
-
 Chtx-Ita5.png 960 × 720; 200 KB
-
 Chtx-Ita6.png 960 × 720; 81 KB
-
 Chtx-Ita7.png 960 × 720; 27 KB
-
 Chtx-Ita8.png 960 × 720; 52 KB
-
 Chtx-Ita9.png 960 × 720; 77 KB
-
 Chtx-Necrotx-Ita.png 960 × 720; 46 KB
-
 Chtx-Publ-hu.png 960 × 720; 9 KB
-
 Chtx-wikifr-1.png 960 × 720; 222 KB
-
 Chtx-wikifr-10.png 960 × 720; 22 KB
-
 Chtx-wikifr-2.png 960 × 720; 70 KB
-
 Chtx-wikifr-3.png 960 × 720; 127 KB
-
 Chtx-wikifr-4.png 960 × 720; 114 KB
-
 Chtx-wikifr-5.png 960 × 720; 321 KB
-
 Chtx-wikifr-6.png 960 × 720; 82 KB
-
 Chtx-wikifr-7.png 960 × 720; 51 KB
-
 Chtx-wikifr-8.png 960 × 720; 70 KB
-
 Chtx10-esp.png 960 × 720; 23 KB
-
 Chtx10-hu.png 960 × 720; 9 KB
-
 Chtx11-esp.png 960 × 720; 75 KB
-
 Chtx2-esp.png 960 × 720; 71 KB
-
 Chtx2-hu.png 960 × 720; 14 KB
-
 Chtx3-hu.png 960 × 720; 20 KB
-
 Chtx3a-esp.png 960 × 720; 134 KB
-
 Chtx4-esp.png 960 × 720; 35 KB
-
 Chtx4-hu.png 960 × 720; 35 KB
-
 Chtx5-esp.png 960 × 720; 249 KB
-
 Chtx5-hu.png 960 × 720; 198 KB
-
 Chtx6-esp.png 960 × 720; 82 KB
-
 Chtx6-hu.png 960 × 720; 37 KB
-
 Chtx7-esp.png 960 × 720; 27 KB
-
 Chtx7-hu.png 960 × 720; 12 KB
-
 Chtx8-esp.png 960 × 720; 47 KB
-
 Chtx8-hu.png 960 × 720; 64 KB
-
 Chtx9-esp.png 960 × 720; 82 KB
-
 Chtx9-hu.png 960 × 720; 20 KB
-
 Chtxasy1-hu.png 960 × 720; 49 KB
-
 Chtxasy2-hu.png 960 × 720; 70 KB
-
 Chtxasy3-hu.png 960 × 720; 83 KB
-
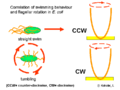 ChtxCCW CW.png 720 × 540; 11 KB
-
 ChtxCRF2.png 960 × 674; 9 KB
-
 Chtxphenomen1.png 960 × 681; 32 KB
-
 Chtxsel.png 960 × 720; 12 KB
-
 Chymosine.png 600 × 500; 80 KB
-
 Comparative genomic hybridization.svg 600 × 400; 123 KB
-
 Cre-lox inversion.svg 783 × 442; 13 KB
-
 Cytozol - ruch cyrkulacyjny.svg 326 × 289; 11 KB
-
 Cytozol - ruch pulsacyjny.svg 357 × 312; 5 KB
-
 Cytozol - ruch rotacyjny.svg 359 × 316; 5 KB
-
 DNA Cloning.png 836 × 591; 33 KB
-
 E coli evolution experiment population A-1.png 1,081 × 759; 42 KB
-
 Eltransoxphos.png 800 × 331; 61 KB
-
 Floculation micellaire.png 504 × 256; 15 KB
-
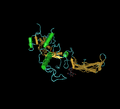
 Follistatin activin Complex.png 486 × 444; 87 KB
-
 Frap diagram.svg 604 × 956; 488 KB
-
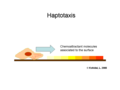 Haptotaxis-en.png 960 × 720; 14 KB
-
 Haptotaxis-es.png 960 × 720; 14 KB
-
 Haptotaxis-fr.png 960 × 720; 14 KB
-
 Haptotaxis-hu.png 960 × 720; 14 KB
-
 Hydrolyse k-caseine.png 575 × 225; 10 KB
-
 IFTcelegans-es.svg 1,437 × 905; 81 KB
-
 IFTcelegans.JPG 1,421 × 900; 145 KB
-
 Illu cell structure.jpg 520 × 291; 51 KB
-
 Inorganic Phosphate symbol.svg 94 × 103; 1 KB
-
 KRAB Domain.png 640 × 480; 41 KB
-
 Labeled chromosomes in CGH.svg 260 × 400; 10 KB
-
 Leucine zipper.png 1,024 × 1,194; 732 KB
-
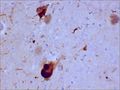
 Lewy bodies (alpha synuclein inclusions) 1.jpg 1,392 × 1,040; 366 KB
-
 Lewy bodies (alpha synuclein inclusions) 2.jpg 1,392 × 1,040; 300 KB
-
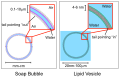 Lipid vesicle vs soap bubble.svg 734 × 475; 1.18 MB
-
 MAPK-evolutionary-tree.png 893 × 772; 43 KB
-
 MCB small icon test.png 40 × 34; 5 KB
-
 Mise en place du complexe d'initiation.jpg 300 × 875; 73 KB
-
 Mitomir 1.svg 1,052 × 744; 524 KB
-
 MSC diagram into osteoblast and chondrocyte cell lineages.jpg 1,148 × 624; 54 KB
-
 NADP symbol.svg 181 × 132; 677 bytes
-
 NADPH symbol.svg 178 × 114; 624 bytes
-
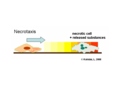 Necrotaxis-en.png 960 × 720; 63 KB
-
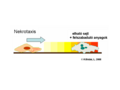 Necrotaxis-hu.png 960 × 720; 63 KB
-
 Noggin.png 486 × 440; 42 KB
-
 Parallel telomere quadruple.png 1,316 × 1,200; 1.5 MB
-
 Pared celular.png 714 × 415; 84 KB
-
 Polysomes.jpg 526 × 308; 32 KB
-
 Primase.jpg 908 × 716; 110 KB
-
 Proton symbol.svg 96 × 96; 838 bytes
-
 Recognition Site of EcoR I Endonuclease.gif 300 × 150; 4 KB
-
 Recognition Site of Hind III Endonuclease.gif 300 × 150; 4 KB
-
 Recognition Site of Hpa I Endonuclease.gif 300 × 150; 4 KB
-
 Recuperação de Fluorescência Após Photobleaching - Princípio(1).JPG 316 × 340; 19 KB
-
 RetroTranscription.jpg 640 × 480; 46 KB
-
 Reverse transcription.svg 748 × 1,284; 477 KB
-
 RNA lysis.svg 592 × 230; 94 KB
-
 Ryanodine Receptor 2.png 2,000 × 2,000; 4.98 MB
-
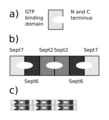 SeptinAssemblySchematic v001.png 600 × 661; 40 KB
-
 Stat1 stucture.png 600 × 270; 72 KB
-
 Stem cell division and differentiation.svg 200 × 400; 36 KB
-
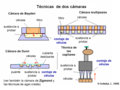 Tecnica dos camras.png 960 × 720; 151 KB
-
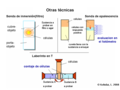 Tecnica otras.png 960 × 720; 110 KB
-
 Tecnica-Agar-esp.png 960 × 720; 68 KB
-
 Telosome.png 741 × 371; 22 KB
-
 Termogenina.png 516 × 600; 55 KB
-
 Tet-ON inducible transgene expression cells.svg 792 × 612; 429 KB
-
 Tetrachimena Beta Tubulin.png 1,012 × 912; 210 KB
-
 Tetrahymena-research.png 960 × 720; 40 KB
-
 Tgf-Beta Receptor I Kinase With Inhibitor.png 486 × 444; 72 KB
-
 TGFbeta1.png 486 × 440; 45 KB
-
 The Modular Structure of Fibronectin and its Binding Domains.png 898 × 371; 47 KB
-
 ThermogeneseAdipozyten pl.svg 744 × 865; 37 KB
-
 ThermogeneseAdipozyten-en.svg 512 × 595; 3 KB
-
 ThermogeneseAdipozyten.svg 744 × 865; 36 KB
-
 Three cell growth types es.png 499 × 507; 191 KB
-
 TNFR1 Cell Signaling.svg 512 × 427; 138 KB
-
 Typical TA sys.jpg 600 × 296; 23 KB
-
 Typical TA sys.png 600 × 296; 45 KB
-
 YeastU4U6other.jpg 967 × 550; 61 KB


_1.jpg)
_2.jpg)


.JPG)


