
Category:Medical statistics
applications of statistics to medicine and the health sciences | |||||
| Upload media | |||||
| Instance of | |||||
|---|---|---|---|---|---|
| Subclass of | |||||
| |||||
Subcategories
This category has the following 7 subcategories, out of 7 total.
A
B
C
E
R
S
V
Media in category "Medical statistics"
The following 44 files are in this category, out of 44 total.
-
 Absolute changes by various pre-test probabilities.png 2,104 × 2,038; 259 KB
-
 Absolute changes by various pre-test probabilities.svg 421 × 408; 68 KB
-
 Medical Heritage Library (IA b22344433).pdf 929 × 1,702, 76 pages; 3.56 MB
-
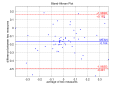 Bland-Altman Plot.svg 512 × 367; 27 KB
-
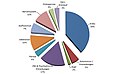
 CHMP opinios.svg 562 × 390; 325 KB
-
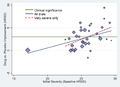
 Claim denial rates by insurance company.webp 2,294 × 1,536; 53 KB
-
 Collected papers (1904) (14591483200).jpg 2,342 × 3,032; 245 KB
-
 Collected papers (1904) (14777848542).jpg 3,232 × 2,546; 294 KB
-

-
 Effetti-deterministici-stocastici.JPG 899 × 265; 19 KB
-

-
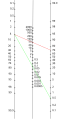
 Fagan nomogram.svg 945 × 1,280; 83 KB
-
 Framingham. Mortalità a lungo termine in base ai RF.jpg 960 × 720; 117 KB
-
 Galleria (6).jpg 3,264 × 1,836; 1.79 MB
-
 Galleria4.jpg 1,836 × 3,264; 1.64 MB
-
 Galleria5.jpg 1,836 × 3,264; 1.89 MB
-
 Indikationen.jpg 1,240 × 763; 187 KB
-
-

-

-
 Measles cases graph.svg 750 × 390; 12 KB
-
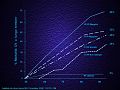
 Medical doctors per 1,000 people vs. GDP per capita, OWID.svg 850 × 600; 26 KB
-
 Nomogramme de Fagan.svg 406 × 731; 61 KB
-
 Nomogramme de Faganb.svg 406 × 731; 61 KB
-
 PDF of H1 Logistic and H2.png 1,657 × 831; 66 KB
-
 Pre- and post-test probabilities for various likelihood ratios.png 2,474 × 2,276; 460 KB
-
 Quantitative Parasitology 30 windows.jpg 1,116 × 670; 88 KB
-
 Quantitative Parasitology on theWeb 10.jpg 921 × 611; 90 KB
-
 Standard deviation of standard reference range limit.png 2,475 × 1,840; 201 KB
-
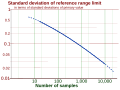 Standard deviation of standard reference range limit.svg 495 × 368; 32 KB
-

-

-

-

-

-

-

-

-

-

-
-
 TempC sampleci.jpg 549 × 399; 33 KB
-
-


_(14591483200).jpg)
_(14777848542).jpg)


.jpg)


.jpg)
.jpg)
.jpg)
.jpg)
.jpg)
.jpg)
.jpg)
.jpg)
.jpg)
.jpg)
.jpg)

.jpg)
.jpg)