Category:Medical charts
Jump to navigation
Jump to search
Subcategories
This category has the following 6 subcategories, out of 6 total.
B
- Medical bar charts (37 F)
- Bioequivalence (4 F)
C
- Charts from DrugStats (1 P, 928 F)
H
P
T
- Medical tree charts (15 F)
Media in category "Medical charts"
The following 82 files are in this category, out of 82 total.
-
"BPI for Patients 19 to 34 years old and Male Patients".jpg 382 × 212; 17 KB
-
1 314382358l.jpg 600 × 337; 32 KB
-
ACEs Pyramid.png 1,266 × 960; 171 KB
-
Atemreflex.jpg 2,193 × 1,561; 570 KB
-
Base-metabolism-rate-men-german.svg 512 × 321; 22 KB
-
Base-metabolism-rate-women-german.svg 512 × 321; 24 KB
-
Blackout.jpg 2,531 × 1,566; 728 KB
-
Blood pressure And risk for IHD (acc JNC 7).jpg 2,480 × 1,754; 303 KB
-
BMI 180 cm height.png 2,151 × 774; 389 KB
-
BMI chart.png 1,920 × 1,080; 499 KB
-
BrocaBMIG.png 2,256 × 1,710; 322 KB
-
BrocaSvg.png 2,259 × 1,714; 128 KB
-
Chart of admissions for influenza (Reeve 003164), National Museum of Health and Medicine.jpg 2,121 × 2,802; 1,001 KB
-
Chowell2014 1918 influenza excess mortality in Spain map.jpg 1,200 × 884; 270 KB
-
CIT-7000-Samples-Cancer-Types-20091103.jpg 610 × 392; 93 KB
-
CO disocijacija HbO2.jpg 657 × 617; 45 KB
-
Cognitive-behavioral model of ME-CFS.jpg 934 × 740; 51 KB
-
Coronary heart disease-score of euro heart survey.png 1,102 × 827; 53 KB
-
Coronary heart disease-score of euro heart survey2.png 997 × 784; 40 KB
-
Davenport Fig 12.jpg 628 × 364; 132 KB
-
Diagrama de Davenport.png 800 × 492; 47 KB
-
Dimensions-of-Post-Exertional-malaise-Infographic.png 600 × 600; 76 KB
-
Diphtheria Chart Colchester Graham-Smith 1902 5.png 2,742 × 1,813; 2.33 MB
-
EndPlate.JPG 438 × 221; 30 KB
-
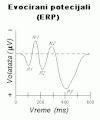
Evocirani potencijali.gif 230 × 275; 4 KB
-
Experiences of Post-exertional Malaise.jpg 2,008 × 959; 185 KB
-
Figure 2. BPI Traumatic event.jpg 434 × 254; 15 KB
-
Figure 3. Incidence of OBPP.jpg 434 × 254; 19 KB
-
Figure 4. Motorcycles and BPI.jpg 436 × 254; 19 KB
-
Flow cytometry 3Dhistogram.png 375 × 256; 99 KB
-
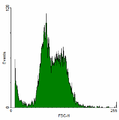
Flow cytometry histogram.png 266 × 268; 4 KB
-
Flow cytometry scatterplot.png 285 × 288; 5 KB
-
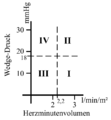
Forrester-classification.png 602 × 653; 19 KB
-
Grierson 158 Cuadro térmico.jpg 1,553 × 885; 621 KB
-
HeatIllnessRisk.svg 600 × 600; 32 KB
-
IMC giovani femm.jpg 600 × 441; 212 KB
-
IMC giovani masch.jpg 600 × 441; 209 KB
-
IMCMort.png 1,156 × 1,200; 1.34 MB
-
Incidence 1.svg 640 × 480; 4 KB
-
Infographic Vaccines Public Health England.pdf 2,291 × 5,229; 1.99 MB
-
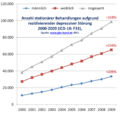
Kh beh depr 00-09 gbe-bund.png 1,736 × 1,639; 336 KB
-
Lifetime Prevalence of Anxiety Disorders (ECA Study).jpg 618 × 475; 81 KB
-
Magenverkleinerung Kostenübernahme Infografik Schweiz, mobile Version.png 662 × 1,616; 92 KB
-
Magenverkleinerung Kostenübernahme Infografik Schweiz.png 1,230 × 976; 115 KB
-
ME-CFS Diagnostic Criteria Comparison.webp 1,773 × 1,566; 53 KB
-
ME-CFS functional status CDC assessment.webp 1,108 × 878; 69 KB
-
Medical Care.jpg 3,000 × 2,000; 904 KB
-
MortalitàBMI.png 800 × 761; 149 KB
-
Parentmanagementtraining effects.JPG 433 × 271; 13 KB
-
Peso CorporeoMortalita.png 600 × 402; 83 KB
-
Prevalence of long Covid symptoms.jpg 1,040 × 640; 105 KB
-
PurineAlimenti.png 300 × 907; 95 KB
-
BMI chart.svg 904 × 701; 100 KB
-
Body mass index chart eu.svg 690 × 575; 230 KB
-
Body mass index chart pl.svg 690 × 575; 225 KB
-
Body mass index chart th.svg 690 × 575; 505 KB
-
Body mass index chart-es.svg 690 × 575; 218 KB
-
Body mass index chart.svg 690 × 575; 219 KB
-
Quality of life long Covid.jpg 1,200 × 1,754; 224 KB
-
QueteletGrafico.png 400 × 333; 44 KB
-
RateMetabolica.jpg 600 × 379; 58 KB
-
TestosteroneCircadiano.png 1,188 × 798; 241 KB
-
TestosteroneEtaGr.png 2,188 × 1,519; 68 KB
-
TestosteroneEtaMol.png 1,046 × 672; 110 KB
-
Trends in the burden of dementia. Age-standardized incidence.png 1,000 × 524; 18 KB
-
Trends in the burden of dementia. Incidence (unadjusted rates).png 1,000 × 567; 24 KB
-
Triggers of Post-exertional malaise.svg 940 × 770; 17 KB
-
Triggers of Post-extertional Malaise.jpg 2,008 × 1,393; 257 KB
-
Urine color test for dehydration.jpg 145 × 242; 4 KB
-
VariazionePesoMortalitàW.png 685 × 345; 260 KB
-
Засићење хемоглобина О2.jpg 505 × 491; 44 KB


