Category:Maps of weather in 2013
Jump to navigation
Jump to search
Please sort by date, if specified
[[Maps of weather in 2013|MMDDhhmm]](in UTC)- take
*for complete year,MM-MMorMMDD-DDfor spans
Subcategories
This category has the following 2 subcategories, out of 2 total.
Media in category "Maps of weather in 2013"
The following 43 files are in this category, out of 43 total.
-
Land and ocean temperature anomalies, February 2013.gif 580 × 448; 68 KB
-
Land-only precipitation percentiles, February-2013.gif 580 × 448; 72 KB
-
February 08-09, 2013 Blizzard Storm Total Snow Accumulation.gif 938 × 1,039; 43 KB
-
Midwest and Northeast US Snow 9 Feb 2013.jpg 9,421 × 5,780; 7.86 MB
-
US Extatropical System 10 Feb 2013.JPG 1,920 × 1,080; 1.56 MB
-
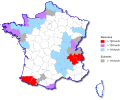
Alerte Météo Alarm 10-02-2013 16h00.svg 2,000 × 1,922; 1.11 MB
-
MODIS temperature map.jpg 720 × 398; 53 KB
-
Illinois flooding disaster areas, April 2013.png 298 × 494; 27 KB
-
Cyclone Mahasen TRMM rainfall estimate.jpg 640 × 360; 39 KB
-
NNVL - Devastating Tornadoes Overnight in Texas.png 2,048 × 1,152; 1.24 MB
-
GOES13 Visible 2013-05-19 231018Z.jpg 1,290 × 1,290; 1.12 MB
-
May 16 to 22, 2013 United States Rainfall.jpg 830 × 479; 106 KB
-
Cpc-ncep-noaa z500 nh 1d 30MAY2013.png 578 × 396; 65 KB
-
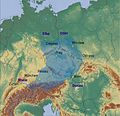
Central Europe 72h rain fall at 2. June 2013.png 674 × 567; 399 KB
-
Central Europe 72h rain fall at 2.6.2013 en.png 674 × 567; 397 KB
-
Central Europe relief map with 2013 rain.jpg 2,048 × 1,984; 3.11 MB
-
NOAA JulAug2013Temp.jpg 610 × 458; 165 KB
-
01C 2013 5day.gif 895 × 716; 26 KB
-
November2013 polar vortex geopotentialheight mean Large.jpg 636 × 689; 261 KB
-
Ontladingen Sinterklaasstorm.png 440 × 397; 225 KB
-
Sinterklaasstorm.gif 622 × 400; 1.54 MB
-
Xaver Bodil surface map 2013-12-05-12UTC.gif 640 × 768; 99 KB
-
Cpc-ncep-noaa CDAS 10-hPa Temp Anoms anim 06DEC2013-05JAN2014.gif 523 × 305; 2.07 MB
-
NHWV.JPG 640 × 480; 39 KB
-
2013-12-12 48h North Atlantic surface forecast.gif 1,728 × 1,100; 78 KB
-
Dirk KNMI 23dec 6h.png 635 × 410; 119 KB
-
Dirk KNMI 23dec 12h.png 635 × 410; 118 KB
-
KNMI 23dec 18h.png 635 × 410; 122 KB
-
Dirk KNMI 24dec 0h.png 635 × 410; 125 KB
-
2013-12-22-05-32-UTC 48h North Atlantic surface forecast.gif 1,728 × 1,100; 84 KB
-
Dirk TPW 20131224 03Z.png 800 × 450; 113 KB
-
Dirk KNMI 24dec 6h.png 635 × 411; 127 KB
-
Dirk KNMI 24dec 12h.png 635 × 410; 121 KB
-
Dirk KNMI 24dec 18h.png 635 × 410; 124 KB
-
Dirk KNMI 25dec 0h.png 635 × 412; 119 KB
-
Dirk KNMI 25dec 6h.png 635 × 410; 118 KB
-
Dirk KNMI 25dec 12h.png 635 × 410; 116 KB
-
Dirk KNMI 25dec 18h.png 635 × 410; 117 KB
-
Dirk KNMI 26dec 0h.png 635 × 410; 120 KB
-
Dirk-vents-fr.svg 974 × 812; 1.14 MB
-
Dirk-vents-Îles Britanniques.svg 1,300 × 2,276; 565 KB
-
JTWC SH0514.gif 1,194 × 836; 28 KB
-
JTWC SH0614.gif 881 × 708; 31 KB


