Category:Maps of petroleum production
Jump to navigation
Jump to search
English: In this category here are maps focused on administrative divisions, who shows statistics about petroleum production
Media in category "Maps of petroleum production"
The following 22 files are in this category, out of 22 total.
-
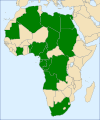
African Petroleum Producers Association members, June 2009.svg 750 × 900; 869 KB
-
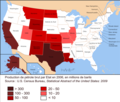
Carte pétrole USA 2006.png 2,500 × 2,116; 850 KB
-
Countries by Oil Production in 2013-ar.svg 863 × 396; 1.33 MB
-
Countries by Oil Production in 2013.svg 863 × 396; 1.22 MB
-
Lista de países por exportação de petróleo.svg 2,560 × 1,314; 1.16 MB
-
Main-qimg-cb86c276439bc5e47ed831033dd01838 (1).jpg 893 × 894; 191 KB
-
OAPEC Members-ar.png 800 × 458; 159 KB
-
OAPEC Members.png 825 × 472; 31 KB
-
Oil Balance.png 1,800 × 820; 158 KB
-
Oil Export 2022.png 1,278 × 624; 55 KB
-
Oil exports.PNG 1,469 × 628; 38 KB
-
Oil imports.PNG 1,469 × 628; 37 KB
-
Oil producing countries map-it.svg 790 × 387; 1.52 MB
-
Oil producing countries map.PNG 1,427 × 628; 45 KB
-
Oil producing countries map.png 1,427 × 628; 60 KB
-
Oil producing USA-states-Canada-provinces map.svg 1,730 × 1,730; 218 KB
-
Oil production in the muslim world.jpg 931 × 547; 137 KB
-
Oil-factor-afghanistan.png 508 × 397; 25 KB
-
OilConsumptionpercapita.png 1,357 × 628; 49 KB
-
Paysexportateursdepetrole.png 800 × 441; 144 KB
-
Somaliland oil.jpg 850 × 667; 107 KB
-
Syria Oil Map.gif 649 × 820; 70 KB


