Category:Maps of ethnic groups in South Africa
Jump to navigation
Jump to search
Countries of Africa: Algeria · Burkina Faso · Cameroon · Republic of the Congo · Djibouti · Equatorial Guinea · Ethiopia · Gabon · Ivory Coast · Libya · Madagascar · Morocco · Niger · Nigeria · Sierra Leone · Somalia · South Africa · Tunisia
Media in category "Maps of ethnic groups in South Africa"
The following 39 files are in this category, out of 39 total.
-
AFS blanc.png 1,847 × 1,835; 1.08 MB
-
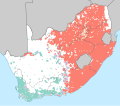
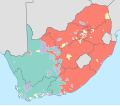
Cape Independence, language, voting patterns and ethnicity.svg 686 × 599; 3.68 MB
-
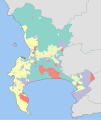
Cape Town 2001 dominant population group map.svg 814 × 966; 1.48 MB
-
Density of European Population in South Africa 1922.jpg 1,522 × 1,238; 413 KB
-
Density of Non-European Population in South Africa 1922.jpg 1,488 × 1,053; 364 KB
-
Eastern Cape 2001 dominant population group map.svg 1,233 × 811; 1.4 MB
-
Ekurhuleni 2001 dominant population group map.svg 778 × 1,011; 1.17 MB
-
Ethekwini 2001 dominant population group map.svg 805 × 977; 3.18 MB
-
Free State 2001 dominant population group map.svg 1,095 × 913; 1.14 MB
-
Gauteng 2001 dominant population group map.svg 996 × 1,004; 897 KB
-
Johannesburg 2001 dominant population group map.svg 786 × 1,000; 1.65 MB
-
KwaZulu-Natal 2001 dominant population group map.svg 938 × 1,066; 995 KB
-
Le Cap Blancs 2011.png 1,838 × 2,565; 1.18 MB
-
Limpopo 2001 dominant population group map.svg 1,228 × 814; 851 KB
-
Mpumalanga 2001 dominant population group map.svg 1,015 × 986; 928 KB
-
Nelson Mandela Bay 2001 dominant population group map.svg 991 × 793; 614 KB
-
North West 2001 dominant population group map.svg 1,208 × 828; 1.07 MB
-
Northern Cape 2001 dominant population group map.svg 990 × 1,010; 1.05 MB
-
Percentage of Europeans in the Cape Colony 1797.png 907 × 511; 105 KB
-
RSA 2001 Prevalent racial.png 1,844 × 1,638; 163 KB
-
RSA 2001 Share BlackAfrican.png 1,844 × 1,638; 163 KB
-
RSA 2001 Share Coloured.png 1,844 × 1,638; 158 KB
-
RSA 2001 Share Indian.png 1,844 × 1,638; 153 KB
-
RSA 2001 Share White.png 1,844 × 1,638; 162 KB
-
Rural white population South Africa 2011.png 1,367 × 1,198; 451 KB
-
South Africa 2011 Black African population density map.svg 809 × 709; 1.83 MB
-
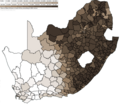
South Africa 2011 Black African population proportion map.svg 809 × 709; 1.07 MB
-
South Africa 2011 Coloured population density map.svg 809 × 709; 1.13 MB
-
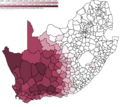
South Africa 2011 Coloured population proportion map.svg 809 × 709; 730 KB
-
South Africa 2011 dominant population group map (hex cells).svg 807 × 711; 807 KB
-
South Africa 2011 dominant population group map.svg 809 × 709; 787 KB
-
South Africa 2011 Indian or Asian population density map.svg 809 × 709; 803 KB
-
South Africa 2011 Indian or Asian population proportion map.svg 809 × 709; 341 KB
-
South Africa 2011 White population density map.svg 809 × 709; 1.19 MB
-
South Africa 2011 White population proportion map.svg 809 × 709; 720 KB
-
South Africa racial map, 1979.gif 940 × 735; 249 KB
-
Tshwane 2001 dominant population group map.svg 821 × 958; 1.42 MB
-
Western Cape 2001 dominant population group map.svg 1,126 × 888; 1.03 MB


