Category:Management diagrams
Appearance
Management diagrams here are diagrams concerning management
Subcategories
This category has the following 29 subcategories, out of 29 total.
A
B
- Balanced Scorecard (19 F)
- BCG plots (16 F)
C
D
E
I
- Management icons (42 F)
- Ishikawa diagrams (24 F)
M
- McKinsey 7S framework (3 F)
O
P
- PDCA (37 F)
- Planogram (4 F)
- Porter's Five Forces Model (14 F)
R
S
- Strategy maps (8 F)
- Systems flowcharts (25 F)
T
- Tecnica del Pomodoro (2 F)
U
V
- Value chain diagrams (27 F)
W
- Waterfall models (35 F)
Pages in category "Management diagrams"
This category contains only the following page.
Media in category "Management diagrams"
The following 200 files are in this category, out of 240 total.
(previous page) (next page)-
1.1shem.jpg 498 × 407; 69 KB
-
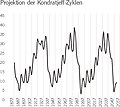
160302 kondratjeff.jpg 590 × 525; 48 KB
-
2 Touch Point Wheel.jpg 667 × 649; 71 KB
-
2.1shem.jpg 500 × 373; 27 KB
-
3K-Modell Kehr.svg 600 × 600; 43 KB
-
5 forze del Porter.svg 580 × 280; 6 KB
-
5 possíveis soluções - 1.jpg 850 × 1,170; 163 KB
-
5 possíveis soluções - 3.jpg 850 × 1,170; 140 KB
-
5S methodology.png 2,137 × 1,622; 220 KB
-
5S methodology.svg 458 × 442; 47 KB
-
6VAB-ambiente.png 305 × 331; 22 KB
-
6VAB-competitividad.png 305 × 331; 24 KB
-
6VAB-estructura.png 305 × 331; 24 KB
-
6VAB-organizacion.png 305 × 331; 25 KB
-
6VAB-personas.png 305 × 331; 26 KB
-
6VAB-tareas.png 305 × 331; 24 KB
-
6VAB-tecnología.png 305 × 331; 25 KB
-
6VAB.png 1,199 × 1,001; 119 KB
-
8-step-process.png 530 × 442; 7 KB
-
A diagram on creating Intergenerational Collaboration in the workplace.jpg 1,007 × 558; 106 KB
-
Abhaengig direkt.jpg 1,056 × 597; 123 KB
-
Abhaengig indirekt.JPG 792 × 498; 31 KB
-
AcceptanceofWorkCompeted.JPG 646 × 484; 39 KB
-
Active vs Passive.jpg 1,275 × 1,650; 116 KB
-
AffinitySmall.gif 100 × 100; 668 bytes
-
AHP keuzestructuur incl cijfers.JPG 738 × 411; 35 KB
-
AHP keuzestructuur.JPG 719 × 398; 30 KB
-
AHP STAP 1.JPG 608 × 167; 25 KB
-
AHP STAP 2.JPG 273 × 104; 7 KB
-
AHP STAP 3 new.JPG 367 × 104; 9 KB
-
AHP STAP 3.JPG 367 × 104; 9 KB
-
AHP STAP 4.JPG 552 × 167; 22 KB
-
AHP TOTAAL.JPG 1,303 × 1,193; 253 KB
-
AIG-Interlocks-2004.jpg 900 × 524; 128 KB
-
Aorta.JPG 344 × 213; 18 KB
-
Ar8n usecase diagram.png 1,028 × 482; 20 KB
-
Arbcomduration.png 481 × 288; 15 KB
-
ASL-einordnung.png 680 × 843; 59 KB
-
At sales Kernkompetenzen.jpg 557 × 318; 17 KB
-
BAW MMP bis 2002.png 777 × 827; 78 KB
-
BAW MMP, 2002 - 2016.jpg 564 × 599; 48 KB
-
BAW MMP, ab 2017.png 559 × 1,526; 811 KB
-
BDAL Diagram.jpg 576 × 474; 55 KB
-
Benefits Dependency Map.png 640 × 393; 50 KB
-
Benefits Dependency Network.png 640 × 374; 42 KB
-
Bestandteile SFM.png 1,363 × 698; 113 KB
-
Bitpim0.9.10.PNG 1,024 × 711; 371 KB
-
Boundaries of the U.S. Regional Fishery Management Councils.jpg 2,273 × 1,880; 219 KB
-
Brainstorming - PSP.jpg 1,170 × 850; 246 KB
-
Business life business model.pdf 1,475 × 885; 183 KB
-
CALIDAD.jpg 640 × 480; 30 KB
-
Carrot Diagram.jpg 794 × 821; 48 KB
-
Carrot Diagram.png 571 × 593; 14 KB
-
Carrot Diagram.svg 900 × 900; 8 KB
-
Category Management Prozess (Deutsch).png 2,667 × 1,500; 154 KB
-
CCandST.jpg 418 × 364; 70 KB
-
Cell production.png 794 × 610; 79 KB
-
CFR-Interlocks-2004.jpg 1,096 × 558; 181 KB
-
CK Diagram.png 655 × 617; 161 KB
-
Clinical audit cycle.jpg 655 × 445; 48 KB
-
Clinichno-upravlenie-bglang.jpg 712 × 618; 150 KB
-
Concept SOA.JPG 960 × 720; 53 KB
-
CONNECT Model.jpg 1,091 × 268; 67 KB
-
Copyright consent -- the 2-stage process.png 2,338 × 1,101; 249 KB
-
Crawford Seven Step Model for Operational Excellence.jpg 960 × 720; 40 KB
-
Customer Knowldege Managemet process model.jpg 584 × 837; 223 KB
-
CyclesProduction.png 640 × 480; 28 KB
-
Definitions of Management.png 596 × 588; 112 KB
-
Deming-PDCA-circle.jpg 648 × 644; 54 KB
-
Demingkwaliteitscirkel.png 967 × 656; 290 KB
-
DestrezasLíderOrganizacional.jpg 972 × 542; 47 KB
-
Device Management.jpg 919 × 468; 38 KB
-
Distributed-Treatments.png 770 × 908; 83 KB
-
Double diamond.gif 630 × 266; 18 KB
-
Dsdm.png 377 × 382; 15 KB
-
Dynamic Competition Theory Chen1996.png 1,369 × 737; 97 KB
-
Een zelf gemaakt schema van het INK management model.jpg 960 × 720; 48 KB
-
EFQM-Modell (Qualitätsmanagement).svg 770 × 360; 17 KB
-
Elements of Industry Structure.svg 461 × 294; 3 KB
-
En4.jpg 1,047 × 241; 41 KB
-
EPK komplexes Beispiel.png 782 × 1,090; 112 KB
-
Epm img.gif 250 × 245; 15 KB
-
Esperenza Users 9-8-06.gif 911 × 623; 6 KB
-
Etape adc.jpg 1,229 × 585; 106 KB
-
Evaluating-thinking-styles.pdf 1,275 × 1,650; 47 KB
-
Evaluating-thinking-styles.png 612 × 792; 12 KB
-
Evaluating-thinking-styles.svg 765 × 990; 39 KB
-
Evaporating Cloud Example.PNG 500 × 250; 9 KB
-
EVR product Matrix.gif 333 × 175; 7 KB
-
Exemple d'Organigramme des Tâches du Projet (OTP).png 1,394 × 517; 42 KB
-
Extreme programming.png 750 × 165; 48 KB
-
F3 - Use Case Diagram.pdf 1,239 × 1,752; 12 KB
-
Facility mang en facilitair mang.JPG 277 × 272; 6 KB
-
Facteurs de performance.jpg 750 × 563; 27 KB
-
FIFO PEPS.png 576 × 379; 8 KB
-
Fig 3 Conceptual Model expressed in Predicate Logic.gif 719 × 959; 6 KB
-
Figure 2 Model with SUN conditions.jpeg 663 × 963; 132 KB
-
Flow-website.svg 512 × 663; 28 KB
-
Flujo de datos.svg 512 × 724; 30 KB
-
Fluxos e estoques.jpg 524 × 421; 32 KB
-
FMEA.png 413 × 320; 37 KB
-
Fonctionnement reseau axenergie.JPG 1,274 × 562; 70 KB
-
Food plant layout parameters.jpg 1,920 × 1,080; 1.21 MB
-
Four Pillars of Manufacturing Engineering.png 1,600 × 2,071; 160 KB
-
Fundamentals of Business - Fig. 8.1 - Levels of Management.jpg 2,185 × 1,688; 842 KB
-
Galbright star model.png 557 × 510; 21 KB
-
Gfx efqm.gif 438 × 260; 12 KB
-
Global Moderation Cheat Sheet.png 1,568 × 1,146; 1.03 MB
-
Grupo7 uc negocio2.jpg 640 × 609; 30 KB
-
Hedge Fund 01.png 332 × 261; 7 KB
-
Herramienta propuesta de valor.png 3,448 × 2,447; 226 KB
-
Hierarchy Community Phenotype Model of Organizational Structure.pdf 1,752 × 1,237; 6 KB
-
Hoshin.jpg 718 × 586; 105 KB
-
Hou710 LeadershipStyles.svg 886 × 425; 33 KB
-
HPM System Diagram.png 692 × 274; 57 KB
-
Identifying-acuities.pdf 1,275 × 1,650; 45 KB
-
Identifying-acuities.png 612 × 792; 7 KB
-
Image d'un arbre.jpg 613 × 391; 21 KB
-
Image logique construction arbre de connaissances.jpg 1,132 × 747; 115 KB
-
Informacoes takt.JPG 381 × 362; 24 KB
-
Ingénieries Développer les compétences.png 1,500 × 757; 98 KB
-
Integriertes Managementsystem.svg 550 × 425; 3 KB
-
Intelligence économique hu.svg 399 × 289; 9 KB
-
Intelligence économique.svg 399 × 289; 8 KB
-
InterrelationshipSmall.gif 100 × 100; 581 bytes
-
Inzetbaarheidmatrix.png 1,114 × 460; 58 KB
-
Isms framework.jpg 600 × 411; 67 KB
-
IT-ASLoverview.png 469 × 378; 8 KB
-
Jay R. Galbraith star model's chinese translation.png 633 × 566; 34 KB
-
Knowledge management.png 2,639 × 1,264; 203 KB
-
Learning process and quality standards.png 919 × 875; 48 KB
-
M-Business.png 1,280 × 775; 43 KB
-
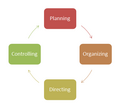
Management Process.png 436 × 392; 9 KB
-
Management Processes.jpg 852 × 263; 31 KB
-
Managementmodellen.jpg 700 × 460; 87 KB
-
Managerial grid POL.svg 457 × 427; 26 KB
-
Mapeamento.png 1,396 × 847; 61 KB
-
Maticová struktura.png 640 × 450; 8 KB
-
MatrixSmall.gif 100 × 100; 928 bytes
-
Mind-map-fayol-nacela.png 1,355 × 807; 45 KB
-
Mind-map-poslovna-etika.png 1,236 × 464; 47 KB
-
Mind-map-stilovi-vodstva.png 2,581 × 789; 121 KB
-
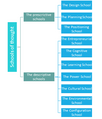
Mintzberg, Schools of thought.png 358 × 419; 16 KB
-
Mixed organization.gif 898 × 617; 12 KB
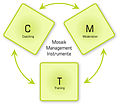
-
MM instrumente.jpg 2,091 × 1,846; 652 KB
-
MM Score Exter.jpg 2,211 × 2,322; 1,014 KB
-
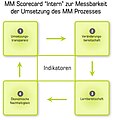
MM Scorecard intern.jpg 2,211 × 2,322; 922 KB
-
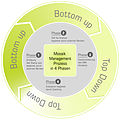
MM-Prozess4Phasen.jpg 2,480 × 2,482; 952 KB
-
Mmss3.png 566 × 378; 25 KB
-
Mmss4.png 801 × 381; 37 KB
-
Mmss5.png 655 × 300; 20 KB
-
Mmss6.png 803 × 98; 10 KB
-
Mmss7.png 799 × 249; 49 KB
-
Mmss8.png 491 × 128; 26 KB
-
Mmss9.png 666 × 199; 37 KB
-
Model of Leader Attributes.jpg 1,012 × 432; 117 KB
-
Modelo PMS 2018.png 1,366 × 768; 340 KB
-
Modelo Porter.png 1,734 × 1,056; 65 KB
-
Mosaik Management.jpg 2,391 × 2,614; 788 KB
-
Neogia ERP features.jpg 450 × 314; 80 KB
-
Neuroticism and Performace.png 552 × 303; 32 KB
-
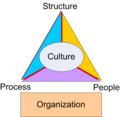
Organization Triangle.png 560 × 548; 33 KB
-
OSTO Systemmodell Prozessvariante.jpg 1,502 × 1,127; 141 KB
-
Outside in management model.jpg 640 × 400; 27 KB
-
PAEI.jpg 420 × 281; 30 KB
-
Parallel running.png 1,024 × 768; 24 KB
-
Pcm.jpg 433 × 336; 14 KB
-
PeintureEquipAuto.png 600 × 200; 9 KB
-
Performance Management System Rigail,A.gif 909 × 508; 73 KB
-
Performance Management Work Framework.png 1,321 × 625; 68 KB
-
Performance Management Work.jpg 1,321 × 625; 215 KB
-
Plans in manufacturing company.JPG 928 × 495; 51 KB
-
Plantilla CANVAS.pdf 1,650 × 1,275; 151 KB
-
Problem Tree.jpg 708 × 401; 35 KB
-
Process for communication management.png 597 × 341; 36 KB
-
ProcessDecisionSmall.gif 100 × 100; 500 bytes
-
Processusdetail.png 640 × 480; 22 KB
-
ProcessusIndustriels.png 640 × 480; 25 KB
-
Product lifecycle management.png 960 × 720; 79 KB
-
Production process model.png 1,181 × 788; 151 KB
-
Project artistic impression.png 764 × 558; 24 KB
-
Project Management Lifecycle.jpg 212 × 213; 18 KB
-
PT5 model.jpg 352 × 320; 29 KB
-
PublicSectorResultsChain.gif 901 × 518; 31 KB
-
Resposta pergunta 1.png 413 × 245; 10 KB
-
Resposta pergunta 2.png 483 × 291; 18 KB
-
Resposta pergunta 3.png 733 × 264; 10 KB
-
Resposta pergunta 4.png 369 × 231; 9 KB
-
Resposta pergunta 5.png 667 × 291; 16 KB
-
Resposta pergunta 6.png 659 × 282; 15 KB
-
Results Chain.png 640 × 372; 59 KB
-
ROSKAB Leadership Model.jpg 960 × 720; 62 KB
-
Roue de Deming.svg 1,167 × 916; 17 KB
-
RoueDeDeming.PNG 1,944 × 1,527; 317 KB
-
Schema Points de Fonction.JPG 519 × 322; 28 KB
-
Schéma 3 rôles.jpg 832 × 651; 158 KB
-
Schéma général d'un système de management de la qualité en amélioration continue.svg 2,112 × 1,152; 56 KB
-
Secundair proces FM.JPG 419 × 538; 28 KB


