Category:Macroeconomic diagrams
Jump to navigation
Jump to search
Subcategories
This category has the following 16 subcategories, out of 16 total.
A
C
- Concentration curve (6 F)
E
I
- Investment function (5 F)
- IS-LM model diagrams (64 F)
- IS/MP model (9 F)
K
- Keynesian cross (14 F)
L
- Laffer curve (1 P, 17 F)
- Loanable funds diagrams (12 F)
M
- Money demand (7 F)
- Mundell-Fleming model (17 F)
P
- Philips curves (33 F)
Media in category "Macroeconomic diagrams"
The following 65 files are in this category, out of 65 total.
-
3-panel diagram.PNG 608 × 567; 32 KB
-
Agricultural surplus.jpg 377 × 242; 28 KB
-
Arbeitssystem.jpg 436 × 403; 65 KB
-
Baumol.png 1,028 × 524; 37 KB
-
CircularFaPNG.png 674 × 743; 129 KB
-
CircularFlowEN-SVG.svg 646 × 711; 541 KB
-
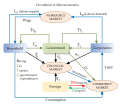
Circulation in macroeconomics.svg 493 × 439; 248 KB
-
Consumption Function.svg 3,012 × 3,012; 23 KB
-
Courbe IS en trappe à liquidité.png 684 × 438; 8 KB
-
Covered-interest-arbitrage.svg 448 × 227; 152 KB
-
Covered-interest-rate-parity.svg 448 × 227; 159 KB
-
Diagram of natural resource flows.jpg 538 × 421; 20 KB
-
Distribution of income in the Ricardian system.png 720 × 540; 3 KB
-
Economic connections between US, EU, China, Russia and India.png 492 × 522; 41 KB
-
Equilibre IS dans les théories à monnaie endogène et exogène.png 1,274 × 381; 23 KB
-
Financial-accelerator.jpg 817 × 728; 54 KB
-
Graphische Darstellung der geldpolitischen Regel.png 694 × 477; 17 KB
-
Graphische Geldpolitische Taylor.png 694 × 477; 18 KB
-
Growth in the North South Model.png 432 × 338; 19 KB
-
I-S and Y=AD to IS NT Wiki.png 778 × 703; 86 KB
-
I=S Y=AD IS curve.svg 744 × 1,052; 149 KB
-
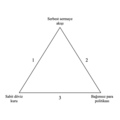
Impossible trinity diagram.svg 759 × 607; 7 KB
-
Intersection of wage and job creation curve.svg 325 × 331; 31 KB
-
Izveduvanje na LM kriva.JPG 778 × 341; 28 KB
-
Kapitalist 1763113693102473216 n.jpg 1,024 × 768; 105 KB
-
Kapitalist 4426752451472729387 qashshoqlik darajasi.jpg 960 × 540; 42 KB
-
Keynes Space image produced by Mathematica.jpg 396 × 248; 31 KB
-
Klassik Keynes.png 881 × 546; 21 KB
-
Knowledge capital and economic growth rates in different regions.png 960 × 960; 71 KB
-
Knowledge capital and economic growth rates in different regions.svg 630 × 630; 27 KB
-
Kuznets curve Ka.jpg 800 × 491; 80 KB
-
Kuznets curve-en.svg 786 × 457; 499 bytes
-
Kuznets curve.png 977 × 600; 15 KB
-
Kuznets curve.svg 786 × 457; 523 bytes
-
Kuznets.jpg 274 × 165; 30 KB
-
Kuznetskurva.svg 640 × 480; 1 KB
-
Life Cycle Hypothesis.jpg 657 × 535; 29 KB
-
Modes de financement d'un stimulus fiscal.png 1,513 × 706; 32 KB
-
Money Market diagram.svg 600 × 600; 118 KB
-
MP-LM-Modell Taylor-Regel.png 691 × 449; 11 KB
-
National income.jpg 676 × 562; 36 KB
-
Neokeynes Ir.jpg 453 × 160; 10 KB
-
NMP (Net material Product) per capita - USSR 1990.png 10,527 × 6,651; 1.36 MB
-
Phasendiagramm 3.jpg 10,752 × 5,554; 1.16 MB
-
PIB per capita.JPG 801 × 389; 41 KB
-
Rahn Curve.svg 512 × 307; 36 KB
-
Shifting production function small.png 395 × 326; 9 KB
-
Shifting production function small.svg 395 × 326; 3 KB
-
State aid eu germany 2000-2012 euro DE.svg 872 × 444; 89 KB
-
State aid eu germany 2000-2012 gdp DE.svg 872 × 444; 93 KB
-
The savings function.png 457 × 374; 8 KB
-
Triangle d'incompatibilité.svg 568 × 386; 12 KB
-
Triangle dincompatibilité.png 628 × 628; 13 KB
-
Tripe Macro (cropped).png 683 × 448; 193 KB
-
Tripe Macro.png 711 × 483; 239 KB
-
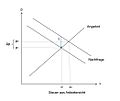
Verbrauchssteuer aus Anbietersicht.jpg 1,046 × 878; 59 KB
-
Verbrauchssteuer aus Nachfragersicht.jpg 990 × 862; 61 KB
-
Volatilityofinflation.PNG 534 × 399; 7 KB
-
WikreiHU.png 773 × 707; 50 KB
-
Ztráta mrtvé váhy.png 1,351 × 558; 12 KB
-
İmkansız üçlü.png 1,000 × 1,000; 53 KB
-
المنحنى البيئي.png 693 × 329; 20 KB


