Category:Linear regression
Jump to navigation
Jump to search
statistical approach for modeling the relationship between a scalar dependent variable and one or more explanatory variables | |||||
| Upload media | |||||
| Instance of |
| ||||
|---|---|---|---|---|---|
| Subclass of |
| ||||
| Facet of | |||||
| Discoverer or inventor | |||||
| |||||
Subcategories
This category has the following 2 subcategories, out of 2 total.
A
- Anscombe's quartet (16 F)
V
Media in category "Linear regression"
The following 160 files are in this category, out of 160 total.
-
ACE2013 Guides.jpg 550 × 296; 47 KB
-
ACP 1.png 720 × 720; 7 KB
-
Ajustement lineaire moindres carres.jpg 542 × 518; 47 KB
-
Ajustement Mayer.svg 400 × 274; 52 KB
-
Arctic Sea Ice Extent, March & September, 1979-2007.png 790 × 429; 18 KB
-
Autokorelacja wypowiedzi.jpg 800 × 580; 143 KB
-
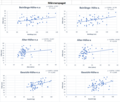
Bostonh hetres Heroskedastische Residuen.svg 450 × 450; 122 KB
-
Bostonh hetres Lineare Regression.svg 450 × 450; 122 KB
-
Bostonh hetres.svg 900 × 450; 347 KB
-
Bostonh sqhetres.svg 900 × 450; 514 KB
-
Cannabis-France-experimentation.svg 600 × 480; 7 KB
-
Chow test example.png 524 × 388; 26 KB
-
Chow test example2.png 524 × 388; 12 KB
-
Chow test structural break.png 784 × 387; 41 KB
-
Chow test substructures.png 870 × 430; 139 KB
-
Chowtest1.svg 714 × 548; 30 KB
-
Chowtest2.svg 707 × 544; 32 KB
-
Chowtest3.svg 694 × 410; 59 KB
-
Chowtest4.svg 711 × 425; 62 KB
-
Chowtest5.svg 694 × 413; 60 KB
-
Chowtest6.svg 694 × 413; 65 KB
-
Chowtest7.svg 694 × 404; 63 KB
-
Chowtest8.svg 708 × 419; 67 KB
-
Clear graph.jpg 281 × 261; 39 KB
-
Comparison of loss functions.png 1,545 × 811; 41 KB
-
Correlatie tussen jaartemperatuur en vinddatum.png 375 × 257; 8 KB
-
CoubePoidsTaille.png 1,188 × 743; 90 KB
-
CurveWeightHeight.png 1,199 × 737; 97 KB
-
Datenreihe1LinGrafikViel.svg 1,445 × 2,055; 81 KB
-
Dispersion-con-regresion.png 575 × 386; 26 KB
-
Effect of multicollinearity on coefficients of linear model.png 688 × 509; 61 KB
-
Example of Two variable linear regression.png 566 × 342; 11 KB
-
Fitting a straight line to a data with outliers.png 1,011 × 610; 48 KB
-
Friedmans mars linear model.png 240 × 240; 2 KB
-
GeoReg2.png 1,123 × 794; 34 KB
-
GewichtLebenstag.svg 450 × 360; 56 KB
-
Gradient descent arrows.svg 459 × 335; 189 KB
-
Grafico regr linear.png 735 × 490; 52 KB
-
Gráfico de dispersão A.svg 466 × 251; 201 KB
-
Gráfico de dispersão B.svg 466 × 251; 179 KB
-
Heightmass-bonf (1).svg 581 × 406; 61 KB
-
Heightmass-wh.svg 581 × 406; 61 KB
-
HeightWeightExample.CorrectConversion.Cubic.Residuals.png 466 × 285; 3 KB
-
HeightWeightExample.CorrectConversion.Quadratic.Residuals.png 465 × 282; 3 KB
-
HeightWeightExample.CorrectConversion.QuadraticFit.png 561 × 420; 4 KB
-
HeightWeightExample.WrongConversion.Quadratic.Residuals.png 465 × 282; 3 KB
-
Heteroscedasticity in Linear Regression.png 626 × 496; 22 KB
-
HistoOhneFehler Regr.png 696 × 474; 7 KB
-
Influential outlier.png 648 × 508; 21 KB
-
KorrRes.png 971 × 772; 9 KB
-
Least squares not robust.jpg 480 × 480; 16 KB
-
Leastsquaresexamp.png 300 × 300; 2 KB
-
Leastsquaresfit.jpg 941 × 600; 35 KB
-
Lineair (residu).PNG 968 × 602; 12 KB
-
Lineair.PNG 968 × 602; 13 KB
-
Linear least squares example.png 428 × 526; 12 KB
-
Linear least squares example2.png 1,245 × 1,569; 52 KB
-
Linear least squares example2.svg 279 × 274; 50 KB
-
Linear least squares(2).svg 502 × 454; 132 KB
-
Linear least squares.svg 512 × 621; 77 KB
-
Linear least squares2.png 889 × 1,067; 30 KB
-
Linear least squares2.svg 154 × 179; 80 KB
-
Linear Regression - it.svg 600 × 480; 42 KB
-
Linear regression of airfare on distance to destination.png 630 × 531; 34 KB
-
Linear regression Qt example.png 1,597 × 321; 8 KB
-
Linear regression scatterplot with generic formula.png 405 × 286; 13 KB
-
Linear regression, rotating coordinate system.gif 900 × 887; 1.73 MB
-
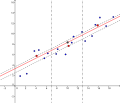
Linear regression.png 447 × 309; 4 KB
-
Linear regression.svg 438 × 289; 71 KB
-
Linear-regression.svg 600 × 480; 7 KB
-
Lineare Regression Bild 2.png 742 × 603; 26 KB
-
LineareFunktionRegression01.png 1,380 × 885; 65 KB
-
LineareFunktionRegression01B.png 1,299 × 885; 59 KB
-
LineareFunktionRegression02.png 1,200 × 654; 52 KB
-
LineareFunktionRegression03.png 1,212 × 654; 42 KB
-
LineareFunktionRegression03B.png 1,245 × 654; 41 KB
-
LineareFunktionRegression04.png 1,200 × 810; 52 KB
-
LineareRegression.jpg 460 × 275; 32 KB
-
LinearRegression.svg 600 × 480; 41 KB
-
Lineáris regresszió.gif 418 × 176; 8 KB
-
Linreg.PNG 351 × 258; 3 KB
-
Linreg.svg 512 × 380; 30 KB
-
Linreg4plot xy.png 1,050 × 648; 12 KB
-
Loi d'Okun.png 480 × 384; 34 KB
-
Median-Median Method.svg 652 × 559; 63 KB
-
Männerspagat lineare Regression.png 744 × 632; 41 KB
-
Nietlineair.PNG 968 × 602; 13 KB
-
Normdist regression.png 494 × 406; 7 KB
-
OLS example weight vs height fitted linear.svg 512 × 320; 5 KB
-
OLSGeometria.jpg 472 × 266; 16 KB
-
OrthogonalLinearLeastSquares.png 846 × 616; 25 KB
-
PlotRegressione.jpg 420 × 339; 14 KB
-
Projected Wealth Inequality.png 1,115 × 784; 153 KB
-
Punkte.png 1,000 × 913; 12 KB
-
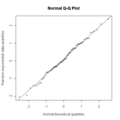
Qqnorm.png 556 × 555; 5 KB
-
R2anim10.svg 388 × 263; 83 KB
-
R2anim11.svg 388 × 263; 83 KB
-
R2anim12.svg 388 × 263; 77 KB
-
R2anim13.svg 388 × 263; 83 KB
-
R2anim14.svg 388 × 263; 84 KB
-
R2anim15.svg 388 × 263; 100 KB
-
R2anim16.svg 388 × 263; 79 KB
-
R2anim17.svg 388 × 263; 79 KB
-
R2anim18.svg 388 × 263; 82 KB
-
R2anim19.svg 388 × 263; 102 KB
-
R2anim2.svg 388 × 263; 71 KB
-
R2anim20.svg 388 × 263; 102 KB
-
R2anim21.svg 388 × 263; 112 KB
-
R2anim22.svg 388 × 263; 97 KB
-
R2anim23.svg 388 × 263; 98 KB
-
R2anim24.svg 388 × 263; 108 KB
-
R2anim25.svg 388 × 263; 97 KB
-
R2anim26.svg 388 × 263; 115 KB
-
R2anim27.svg 388 × 263; 115 KB
-
R2anim28.svg 388 × 263; 116 KB
-
R2anim29.svg 388 × 263; 117 KB
-
R2anim3.svg 388 × 263; 71 KB
-
R2anim30.svg 388 × 263; 127 KB
-
R2anim31.svg 388 × 263; 113 KB
-
R2anim32.svg 388 × 263; 133 KB
-
R2anim33.svg 388 × 263; 133 KB
-
R2anim34.svg 388 × 263; 81 KB
-
R2anim35.svg 388 × 263; 81 KB
-
R2anim4.svg 388 × 263; 71 KB
-
R2anim5.svg 388 × 263; 74 KB
-
R2anim6.svg 388 × 263; 77 KB
-
R2anim7.svg 388 × 263; 81 KB
-
R2anim8.svg 388 × 263; 58 KB
-
R2anim9.svg 388 × 263; 56 KB
-
R2explain.svg 363 × 263; 85 KB
-
R2intro.svg 413 × 375; 132 KB
-
R2values.svg 270 × 263; 83 KB
-
Regresión lineal criterio distancia.png 377 × 207; 7 KB
-
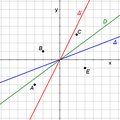
Regresión lineal dirección.png 825 × 280; 11 KB
-
Regresión lineal ejemplo comparativo.png 358 × 359; 11 KB
-
Regresión lineal varios casos.png 444 × 413; 12 KB
-
Regression Analysis-1.png 766 × 523; 27 KB
-
Regression Analysis-2.png 765 × 523; 26 KB
-
Regression lineaire abscisses ordonnees orthogonal.svg 317 × 384; 46 KB
-
Regression lineaire abscisses ordonnees.svg 317 × 384; 46 KB
-
Regression lineaire abscisses.svg 317 × 384; 41 KB
-
Regression lineaire avec R.svg 650 × 593; 75 KB
-
Regression lineaire ordonnees orthogonal.svg 317 × 384; 44 KB
-
Regression lineaire ordonnees.svg 317 × 384; 42 KB
-
Regression lineaire orthogonal.svg 317 × 384; 41 KB
-
Regression lois statistiques fiabilite locotracteur.svg 584 × 456; 242 KB
-
Regression plane avec R.svg 268 × 240; 19 KB
-
Residuals for Linear Regression Fit.png 1,200 × 800; 36 KB
-
RQuadroLinearita.jpg 505 × 211; 12 KB
-
Scatterplot WithLRForumulaIndicated.png 428 × 441; 10 KB
-
Si Poll2.jpg 4,080 × 4,046; 739 KB
-
SLO Polls.jpg 3,540 × 3,450; 560 KB
-
Tableaux resultats regression lineaire multiple.jpg 559 × 447; 68 KB
-
Total least squares.jpg 299 × 237; 7 KB
-
Total least squares.svg 577 × 572; 11 KB
-
Variables independantes.svg 359 × 274; 41 KB
-
Wtc7-nist1a-fig3-15.jpg 412 × 281; 34 KB
-
Линия регрессии и 95% доверительные области.jpg 710 × 564; 33 KB


