Category:Information graphics about economy of the Soviet Union
Jump to navigation
Jump to search
Subcategories
This category has the following 2 subcategories, out of 2 total.
Media in category "Information graphics about economy of the Soviet Union"
The following 18 files are in this category, out of 18 total.
-
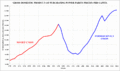
 FormerUSSRRepublicsGDPPC.svg 570 × 234; 202 KB
-
 GDP per capita development of the Soviet Union.svg 850 × 600; 31 KB
-
 GDP per capita of the Eastern Bloc.png 1,109 × 612; 54 KB
-
 GDP per capita URSS.png 1,241 × 721; 62 KB
-
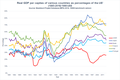
 GDP per capita USSR.png 1,089 × 656; 75 KB
-
 GermanImports USSRPerCent.jpg 907 × 650; 133 KB
-
 Migrafico2.png 906 × 523; 28 KB
-
 Migráfico.png 906 × 520; 24 KB
-
 Motor vehicle production in the USSR 1929-1950.png 647 × 402; 10 KB
-
 NMP (Net material Product) per capita - USSR 1990.png 10,527 × 6,651; 1.36 MB
-
 Production of passenger cars in the USSR 1960-1979.png 649 × 404; 24 KB
-
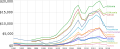
 Real GDP per capitas of countries relative to the US' MDP.png 960 × 642; 68 KB
-
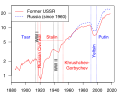 Russian economic history 1885-2018.svg 405 × 315; 65 KB
-
 Soviet Union GDP per capita.gif 952 × 565; 38 KB
-
 Soviet Union GDP.gif 1,400 × 948; 75 KB
-
 Soviet Union USSR GDP per capita.png 1,138 × 714; 162 KB
-
 USSR GDP per capita.png 1,076 × 578; 75 KB
-
 Статистическая таблица Внешней торговли СССР за 1938 - 1940 годы.jpg 2,372 × 1,144; 993 KB


_per_capita_-_USSR_1990.png)


