Category:Information graphics about cancer
Jump to navigation
Jump to search
Subcategories
This category has the following 3 subcategories, out of 3 total.
M
S
Media in category "Information graphics about cancer"
The following 200 files are in this category, out of 238 total.
(previous page) (next page)-
A HSC functional assay.jpg 700 × 1,113; 207 KB
-
Adverse effects of tobacco smoking.png 1,967 × 2,067; 1.1 MB
-
Angiogenesis.png 399 × 169; 8 KB
-
AnnotatorPublicV1.png 510 × 286; 46 KB
-
Behandlungsalternativen 110609 FK.png 720 × 540; 9 KB
-
BladderCancerTNMCAT.svg 728 × 456; 23 KB
-
Cancer Deaths by type, 2019 (HY).png 1,806 × 1,452; 300 KB
-
Cancer division cellulaire NIH traduction française.png 183 × 384; 121 KB
-
Cancer drugs only work on some cancer cells.jpg 800 × 1,037; 238 KB
-
Cancer of the scrotum Wellcome L0062115.jpg 4,316 × 5,708; 4.53 MB
-
Cancer progression from NIH hu.png 423 × 265; 96 KB
-
Cancer progression from NIH japanese.png 423 × 265; 347 KB
-
Cancer progression from NIH.png 423 × 265; 99 KB
-
Cancer requires multiple mutations from NIH hu.png 156 × 459; 20 KB
-
Cancer requires multiple mutations from NIH-sv.png 156 × 459; 25 KB
-
Cancer requires multiple mutations from NIH.png 530 × 1,094; 162 KB
-
Cancer requires multiple mutations from NIHen.png 156 × 459; 11 KB
-
Cancerinvasion.jpg 3,000 × 2,600; 1.53 MB
-
Ch cancer progression.png 874 × 510; 409 KB
-
Chimney sweep's cancer Wellcome L0062113.jpg 3,976 × 5,664; 5.53 MB
-
ColonCancerTreatment.jpg 614 × 329; 54 KB
-
Comparison between normal and tumor vasculature.jpg 800 × 600; 256 KB
-
Cáncer1.png 178 × 374; 34 KB
-
Diagram of a 3 in 1 incision vulvectomy CRUK 018-ar.svg 500 × 312; 159 KB
-
Diagram of a 3 in 1 incision vulvectomy CRUK 018.svg 500 × 312; 19 KB
-
Diagram of a larkel CRUK 021.svg 375 × 249; 84 KB
-
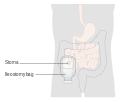
Diagram of an ileostomy with a bag CRUK 030.svg 375 × 320; 45 KB
-
Diagram showing a bone marrow biopsy CRUK 051.svg 375 × 318; 170 KB
-
Diagram showing a brain shunt CRUK 052-es.svg 375 × 365; 96 KB
-
Diagram showing a brain shunt CRUK 052.svg 375 × 365; 81 KB
-
Diagram showing a bronchoscopy CRUK 053 pl.svg 375 × 383; 228 KB
-
Diagram showing a bronchoscopy CRUK 053.svg 375 × 383; 228 KB
-
Diagram showing a bronchoscopy CRUK Trim.svg 345 × 354; 253 KB
-
Diagram showing a burr hole biopsy CRUK 055.svg 375 × 387; 80 KB
-
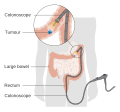
Diagram showing a colonoscopy CRUK 060.svg 375 × 282; 83 KB
-
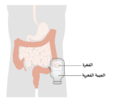
Diagram showing a colostomy with a bag CRUK 061-ar.png 1,200 × 1,024; 122 KB
-
Diagram showing a colostomy with a bag CRUK 061-hu.svg 375 × 320; 57 KB
-
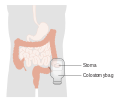
Diagram showing a colostomy with a bag CRUK 061.svg 375 × 320; 56 KB
-
Diagram showing a continent urinary diversion CRUK 062.svg 375 × 360; 60 KB
-
Diagram showing a cystoscopy for a man and a woman CRUK 064-ar.png 375 × 555; 72 KB
-
Diagram showing a cystoscopy for a man and a woman CRUK 064.svg 375 × 555; 58 KB
-
Diagram showing a lobectomy of the thyroid gland CRUK 067.svg 360 × 439; 276 KB
-
Diagram showing a malignant tumour CRUK 069.svg 375 × 305; 212 KB
-
Diagram showing a PICC line CRUK 071.svg 375 × 266; 57 KB
-
Diagram showing a primary and secondary cancer CRUK 074.svg 375 × 301; 37 KB
-
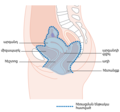
Diagram showing a rectosigmoid pouch CRUK 077.svg 375 × 365; 98 KB
-
Diagram showing a transperineal prostate biopsy CRUK 473-ca.svg 380 × 368; 388 KB
-
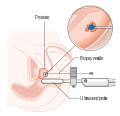
Diagram showing a transperineal prostate biopsy CRUK 473.svg 380 × 368; 323 KB
-
Diagram showing a tumour causing spinal cord compression CRUK 081-ca.svg 250 × 253; 1.14 MB
-
Diagram showing a tumour causing spinal cord compression CRUK 081.svg 309 × 251; 912 KB
-
Diagram showing a voice valve CRUK 086.svg 375 × 350; 24 KB
-
Diagram showing a wide local excision of the vulva CRUK 088.svg 500 × 312; 18 KB
-
Diagram showing a woman having a mammogram CRUK 089.svg 375 × 314; 48 KB
-
Diagram showing abdominoperineal resection of the anus CRUK 091.svg 375 × 330; 50 KB
-
Diagram showing an airway stent CRUK 095.svg 375 × 367; 521 KB
-
Diagram showing an implantable port CRUK 101 pl.svg 375 × 242; 50 KB
-
Diagram showing an implantable port CRUK 101.svg 375 × 242; 50 KB
-
Diagram showing an implantable port under the skin CRUK 100 pl.svg 375 × 314; 11 KB
-
Diagram showing an implantable port under the skin CRUK 100.svg 375 × 314; 11 KB
-
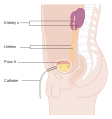
Diagram showing drug treatment into the bladder CRUK 114.svg 345 × 405; 162 KB
-
Diagram showing ductal carcinoma in situ (DCIS) CRUK 115.svg 375 × 442; 101 KB
-
Diagram showing fluid (ascites) being drained from the abdomen CRUK 122 (hy).png 1,500 × 1,570; 213 KB
-
Diagram showing fluid in the abdomen CRUK 123.svg 375 × 412; 21 KB
-
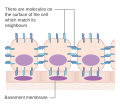
Diagram showing how cells know when to stop dividing CRUK 128.svg 375 × 372; 265 KB
-
Diagram showing how cells know when to stop growing CRUK 129.svg 375 × 331; 507 KB
-
Diagram showing how cells reproduce CRUK 130.svg 345 × 328; 106 KB
-
Diagram showing how new cells end up in the right place CRUK 133.svg 375 × 329; 224 KB
-
Diagram showing how new genes are made for new cells CRUK 134.svg 375 × 473; 36 KB
-
Diagram showing how normal cells make up the tissue in our body CRUK 135.svg 375 × 277; 1.78 MB
-
Diagram showing how you have chemotherapy into the abdomen CRUK 158.svg 375 × 316; 112 KB
-
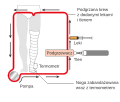
Diagram showing isolated limb infusion without oxygen CRUK 163.svg 375 × 334; 31 KB
-
Diagram showing keyhole hysterectomy CRUK 164-ar.png 563 × 548; 84 KB
-
Diagram showing keyhole hysterectomy CRUK 164.svg 375 × 365; 45 KB
-
Diagram showing laparoscopic surgery for kidney cancer CRUK 165.svg 375 × 335; 168 KB
-
Diagram showing lobular carcinoma in situ (LCIS) CRUK 166.svg 378 × 445; 83 KB
-
Diagram showing most common sites breast cancer spreads to CRUK 169.svg 375 × 465; 145 KB
-
Diagram showing one option for stage 2Ba lung cancer CRUK 176.svg 330 × 280; 491 KB
-
Diagram showing one option for stage 2Bb lung cancer CRUK 177.svg 425 × 296; 496 KB
-
Diagram showing regional limb perfusion CRUK 185 pl.svg 395 × 333; 27 KB
-
Diagram showing regional limb perfusion CRUK 185.svg 375 × 333; 27 KB
-
Diagram showing secondary stomach cancer in the lungs CRUK 186.svg 375 × 266; 110 KB
-
Diagram showing surgery through the nose CRUK 275.svg 375 × 401; 53 KB
-
Diagram showing the anatomy of the gallbladder CRUK 283.svg 375 × 235; 38 KB
-
Diagram showing the anatomy of the penis CRUK 284.svg 375 × 306; 36 KB
-
Diagram showing the area removed for a rectal cancer CRUK 286.svg 375 × 415; 223 KB
-
Diagram showing the cell that ALL starts in CRUK 295.svg 278 × 355; 371 KB
-
Diagram showing the cells CLL afects CRUK 296.svg 280 × 451; 8 KB
-
Diagram showing the cells in which AML starts CRUK 297 pl.svg 290 × 355; 372 KB
-
Diagram showing the cells in which AML starts CRUK 297.svg 275 × 355; 372 KB
-
Diagram showing the cells in which AML starts CRUK 297hy. developmental.png 800 × 1,033; 90 KB
-
Diagram showing the circulatory system of the body CRUK 299.svg 350 × 420; 35 KB
-
Diagram showing the parts of the oropharynx CRUK 332.svg 375 × 325; 45 KB
-
Diagram showing the position of a nasogastric tube CRUK 340.svg 375 × 320; 31 KB
-
Diagram showing the position of the lymph nodes in the neck CRUK 353.svg 425 × 291; 269 KB
-
Diagram showing the position of the thymus gland CRUK 362.svg 375 × 282; 143 KB
-
Diagram showing the transformation zone on the cervix CRUK 375.svg 375 × 375; 83 KB
-
Diagram showing where blood cells are made in the body CRUK 379.svg 300 × 340; 311 KB
-
DIagram showing where lymphoma can spread in the body CRUK 382.svg 375 × 455; 214 KB
-
Diagram showing where the lymph nodes are in the neck CRUK 384.svg 347 × 344; 213 KB
-
Diagram showing where the ventricles are in the brain CRUK 387.svg 375 × 310; 80 KB
-
Diagram showing which cells CML can start in CRUK 388.svg 353 × 376; 10 KB
-
Diagrama de una cistoscopia en un hombre y una mujer.svg 375 × 555; 58 KB
-
Diagrama mostrando una colonoscopia.svg 375 × 282; 84 KB
-
FluoropyrimidineActivity WP1601.png 699 × 1,022; 69 KB
-
Fromsec4 3.png 717 × 577; 7 KB
-
Hallmarks of cancer.svg 397 × 217; 210 KB
-
Hierarchical and stochastic models of tumour cell heterogeneity.jpg 570 × 1,336; 229 KB
-
Homologous Recombination-dependent DNA Replication Model of ALT.jpg 700 × 740; 179 KB
-
How a signal can alter cellular processes.jpg 736 × 996; 159 KB
-
Inter-site and intratumoural heterogeneity between metastases.jpg 700 × 824; 212 KB
-
Interpatient heterogeneity.jpg 700 × 600; 102 KB
-
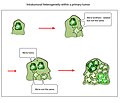
Intratumoral heterogeneity.jpg 700 × 600; 100 KB
-
IrinotecanPathway WP229.png 769 × 905; 40 KB
-
Krebsentstehung 110623aFK.png 1,015 × 640; 1.86 MB
-
Krebsentstehung T2 110623 FK.png 742 × 470; 1,023 KB
-
Metoda PSP diagram.jpg 774 × 342; 59 KB
-
Model of Avastin inhibition.jpg 700 × 1,394; 288 KB
-
Models of tumour suppression.svg 399 × 406; 73 KB
-
Molecular mechanisms of p53 in cells under normal and stressed conditions.jpg 815 × 1,023; 183 KB
-
Multi Onco.jpg 1,046 × 553; 542 KB
-
Next-generation Hallmarks of Cancer wheel with labels.svg 512 × 512; 40 KB
-
NIHR-infographic-breast-cancer-age.png 1,024 × 448; 83 KB
-
NIHR-infographic-breast-risk-factors.png 1,024 × 1,024; 230 KB
-
Normal cancer cell division from NIH cs.png 183 × 384; 29 KB
-
Oncogene.jpg 611 × 738; 135 KB
-
Ortenau Klinikum Schaubild Teilentfernung Bauchspeicheldruese.jpg 3,307 × 1,181; 636 KB


