Category:Inflation graphs of the United Kingdom
Jump to navigation
Jump to search
Media in category "Inflation graphs of the United Kingdom"
The following 11 files are in this category, out of 11 total.
-
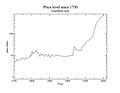 Price level United Kingdom since 1750 logarithmic.jpg 792 × 612; 27 KB
-
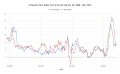 UK and US 1989-present monthly CPI.svg 1,132 × 700; 392 KB
-
 UK inflation rate 1800 to present.svg 929 × 574; 183 KB
-
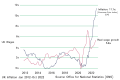 UK Inflation to Real Wages Jan 2012-Oct 2022.svg 3,000 × 2,000; 22 KB
-
 UK price inflation over 750 years.JPG 1,482 × 1,058; 95 KB
-
 UKCPIApril2012ToApril2022.png 1,555 × 951; 65 KB
-
 UKinflation change.png 437 × 363; 38 KB
-
 UKinflation.png 539 × 438; 27 KB
-
 United Kingdom CPI changes, 1989 to present.svg 750 × 440; 13 KB
-
 United Kingdom CPI changes, 1997 to present.svg 820 × 480; 14 KB
-
 United Kingdom CPI, 1988 to present.svg 836 × 480; 17 KB


