Category:Human proteins
Jump to navigation
Jump to search
Wikimedia category | |||||
| Upload media | |||||
| Instance of | |||||
|---|---|---|---|---|---|
| |||||
Subcategories
This category has the following 25 subcategories, out of 25 total.
A
- Actin-related protein 2 (6 F)
E
- Erythropoietin (20 F)
H
I
- Interleukin-15 (8 F)
L
- LINGO-1 (2 F)
M
- Matrix gla protein (6 F)
- Mu-opioid receptors (7 F)
- Myelin basic proteins (18 F)
N
- NBEAL1 (7 F)
P
- PNLIPRP2 (6 F)
R
- Ribosomal protein L3 (3 F)
S
- Sclerostin (15 F)
T
V
Media in category "Human proteins"
The following 200 files are in this category, out of 567 total.
(previous page) (next page)-
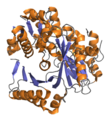
1BQS.pdb.png 1,436 × 759; 182 KB
-
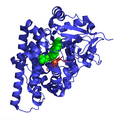
1bwn opm.png 829 × 669; 104 KB
-
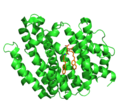
1HLE.png 640 × 480; 98 KB
-
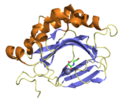
1NFI.png 960 × 720; 233 KB
-
1pkw.png 480 × 451; 173 KB
-
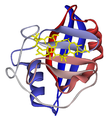
1rct.png 366 × 362; 130 KB
-
1sg1.png 439 × 249; 67 KB
-
1SZP.jpg 250 × 250; 26 KB
-
2-Glyceraldehyde-3-phosphate dehydrogenase 3GPD wpmp.png 946 × 826; 316 KB
-
2B9R.png 640 × 480; 142 KB
-
2bct murinebcat.jpg 500 × 500; 36 KB
-
2cs4 PDB n-terminal domain chromosome 12 ORF 2.png 454 × 420; 123 KB
-
2D26.png 640 × 434; 89 KB
-
2HNX.png 960 × 720; 215 KB
-
2ILA.png 960 × 720; 205 KB
-
2J5H.pdb.jpg 954 × 491; 43 KB
-
2JIH.png 640 × 434; 99 KB
-
2klc rainbow all states.png 800 × 800; 277 KB
-
2L9N.png 1,440 × 1,080; 294 KB
-
2mkv.png 700 × 700; 48 KB
-
2pha humanarginase.png 552 × 560; 208 KB
-
2RH1.png 2,800 × 1,703; 456 KB
-
2RJP.png 640 × 480; 117 KB
-
2VDX.png 640 × 480; 100 KB
-
2vqj.png 940 × 570; 285 KB
-
2vre.png 365 × 369; 131 KB
-
2VSZ.pdb1.png 1,436 × 759; 199 KB
-
2X4F.pdb.png 724 × 676; 213 KB
-
2xp2.png 517 × 403; 159 KB
-
2y23.png 822 × 357; 95 KB
-
2ygw.png 467 × 324; 130 KB
-
2yl2.png 314 × 349; 108 KB
-
2ZV6.png 640 × 480; 98 KB
-
3b6r.png 349 × 342; 97 KB
-
3dwb.png 355 × 331; 129 KB
-
3edg.png 1,674 × 893; 161 KB
-
3EE6.png 640 × 434; 152 KB
-
3N7S.pdb.png 619 × 484; 100 KB
-
3n9y.png 329 × 338; 85 KB
-
3nkr.png 600 × 600; 206 KB
-
3q30.png 317 × 287; 82 KB
-
3q9p.png 662 × 374; 69 KB
-
3rcq.png 386 × 324; 91 KB
-
3ruk.png 250 × 318; 75 KB
-
3s4eskrp1.png 676 × 514; 172 KB
-
3u1n.png 440 × 322; 147 KB
-
3u84menin.png 379 × 272; 88 KB
-
3un9 ctermhex.png 430 × 496; 232 KB
-
3uon.png 228 × 361; 76 KB
-
4a4c.png 606 × 508; 185 KB
-
4acr.png 447 × 216; 73 KB
-
4c0p transportin3.png 1,000 × 1,000; 328 KB
-
4c6c.png 500 × 500; 171 KB
-
4dkc.png 427 × 247; 92 KB
-
4hze.jpg 607 × 589; 211 KB
-
4ihb pdb.png 600 × 600; 97 KB
-
4j3ncartoon.png 600 × 600; 303 KB
-
4lu3.png 800 × 800; 254 KB
-
4m6r apip.png 1,000 × 1,000; 664 KB
-
4m91.png 700 × 700; 159 KB
-
4n6h.png 500 × 594; 138 KB
-
4nfb red PILRA 4nfc yellow PILRB.png 800 × 800; 260 KB
-
4nn2.png 1,000 × 1,000; 265 KB
-
4pyp glut1.png 600 × 600; 162 KB
-
6COX.png 1,600 × 1,196; 1.48 MB
-
7m4r chainsAC.png 1,024 × 768; 415 KB
-
AAK1 prot.png 1,920 × 975; 613 KB
-
Activation of Elk1 by various signal transduction pathways..jpg 720 × 540; 40 KB
-
ADCY9.png 1,920 × 975; 699 KB
-
ADH4 prot.png 1,920 × 975; 1.01 MB
-
ADPLA protein active site.jpg 836 × 401; 81 KB
-
ADPLA protein structure.jpg 809 × 482; 67 KB
-
AFP prot.png 1,920 × 975; 552 KB
-
Agtr1.png 1,920 × 975; 586 KB
-
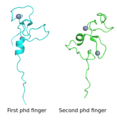
Aire protein (first- and second phd fingers).png 598 × 613; 71 KB
-
Alpha2-macroglobulin-4ACQ.jpg 3,412 × 1,440; 807 KB
-
Altern splicing CXorf26.JPG 497 × 160; 14 KB
-
ANGPTL3.png 1,920 × 975; 354 KB
-
ANGPTL4.png 1,920 × 975; 407 KB
-
Anhidrasa Carbonica.png 500 × 500; 99 KB
-
ANK2 prot.png 1,920 × 975; 624 KB
-
Annotated Translation.jpg 960 × 720; 94 KB
-
ANXA1.png 1,920 × 975; 403 KB
-
APOC3.png 1,920 × 975; 264 KB
-
APOL1.png 1,920 × 975; 945 KB
-
Artemin Tertiary Structure.png 442 × 332; 59 KB
-
ASMT protein.png 1,920 × 975; 671 KB
-
ASPM protein.png 1,920 × 975; 494 KB
-
Asymmetric unit.jpg 500 × 500; 30 KB
-
Atlas-legend.png 26 × 26; 4 KB
-
ATP7A 1.jpg 500 × 500; 25 KB
-
Aurora B localization.jpg 93 × 349; 8 KB
-
Beta-2-adrenergic-receptor-electrostatic-top.png 768 × 1,024; 477 KB
-
Beta-2-adrenergic-receptor.png 768 × 1,024; 457 KB
-
BID protein 2bid.png 586 × 530; 199 KB
-
Binding of GRIP1 to AMPA Receptors.jpg 815 × 838; 88 KB
-
BIOI Protein Representation.png 794 × 386; 81 KB
-
BMP4 Signal Transduction Pathways.gif 720 × 540; 28 KB
-
Brain Atlas.jpg 626 × 437; 49 KB
-
BUB3 protein.jpg 250 × 250; 19 KB
-
C-Myc-DNA complex.png 1,053 × 708; 290 KB
-
C10orf35 Expression in Humans.png 1,003 × 336; 17 KB
-
C11orf42 Conceptual Translation.png 1,129 × 958; 116 KB
-
C11orf42 direction.png 748 × 149; 11 KB
-
C11orf42 location.png 485 × 63; 997 bytes
-
C11orf42 Protein Schematic.png 537 × 95; 21 KB
-
C11orf73aachangesperyeargraph.jpg 798 × 281; 46 KB
-
C11orf73identityvsdivergencegraph.jpg 752 × 293; 46 KB
-
C16orf78 RNA expression.png 879 × 344; 27 KB
-
C16orf78 Tissue Expression Profile Graph.png 1,607 × 346; 16 KB
-
C16orf78Diagram.png 213 × 40; 7 KB
-
C16orf86 gene image.gif 485 × 87; 1 KB
-
C16orf86-gene.png 720 × 90; 1 KB
-
C19orf67 Neigh.gif 485 × 63; 902 bytes
-
C1orf141 Conceptual Tranlastion.png 1,214 × 777; 361 KB
-
C1orf141 Expression.png 1,813 × 550; 45 KB
-
C1orf141 Tertiary Structure Model.jpg 350 × 350; 104 KB
-
C1orf167 Schematic Illustration.png 1,160 × 40; 10 KB
-
C1orf198 Gene Diagram.png 668 × 90; 9 KB
-
C1orf198 Gene Expression.png 1,702 × 612; 111 KB
-
C1orf198 Gene Location Chromosome 1.png 2,310 × 270; 105 KB
-
C1orf198 Gene Location.png 1,444 × 184; 26 KB
-
C1orf198 Tissue Expression.png 2,042 × 738; 147 KB
-
C1orf198-gene.png 720 × 90; 1 KB
-
C1orf21 Cytogenic Band.png 720 × 90; 1 KB
-
C1orf21 PHYRE.png 400 × 400; 18 KB
-
C1orf21 Tree.png 1,251 × 793; 89 KB
-
C22orf31 conceptual translation including post-translational modifications, domains, and features.pdf 1,275 × 1,650, 2 pages; 96 KB
-
C2orf16 Isoform 2 Predicted 3D Structure.png 800 × 810; 254 KB
-
C2orf72tertiary.png 556 × 458; 78 KB
-
C4Orf51 paralogs, via BLAST.png 2,272 × 542; 187 KB
-
C4orf51 Schematic Illustration.png 1,236 × 459; 62 KB
-
C5.png 415 × 348; 154 KB
-
C6orf10 Isoform a Domains.png 1,786 × 696; 110 KB
-
C6orf10 Isoform a MSA 1.png 1,778 × 1,104; 527 KB
-
C6orf10 isoform a secondary strucutre.png 1,384 × 568; 163 KB
-
C7orf26 locus.gif 485 × 51; 886 bytes
-
C7orf26 Unrooted Tree.png 1,043 × 586; 75 KB
-
C8ORF47 Liver Expression.PNG 1,067 × 602; 114 KB
-
C9orf50 Isoform Table.png 974 × 472; 360 KB
-
C9orf50 Isoforms and Transcript Variants.png 1,590 × 330; 159 KB
-
C9orf50 Molecular Clock.png 787 × 562; 73 KB
-
C9orf50 Schematic Illustration.png 1,582 × 574; 205 KB
-
CACNA1A.png 1,920 × 975; 743 KB
-
Calcitonin.png 342 × 139; 25 KB
-
CalciumRegulationInCardiacCell WP536.png 1,630 × 1,086; 154 KB
-
Cartoon of neurexin and neurolign interaction.png 800 × 550; 104 KB
-
CBlast 72-272 asparagines.png 326 × 452; 118 KB
-
CCDC132 cartoon.png 818 × 82; 7 KB
-
CCL23.png 1,920 × 975; 688 KB
-
CD123.png 1,920 × 975; 521 KB
-
CD2 antigen.png 514 × 367; 7 KB
-
CD200.png 1,920 × 975; 395 KB
-
CD226.png 1,920 × 975; 391 KB
-
CD300A.png 1,920 × 975; 384 KB
-
CD33 protein.png 1,920 × 975; 683 KB
-
CD48 protein.png 1,920 × 975; 314 KB
-
CD58 protein.png 1,920 × 975; 355 KB
-
CD59 2j8b.png 800 × 1,200; 309 KB
-
CD73 prot.png 1,920 × 975; 595 KB
-
CD84 protein.png 1,920 × 975; 506 KB
-
CD86 structure.gif 300 × 300; 608 KB
-
CDC20.png 1,920 × 975; 346 KB
-
Ceruloplasmin.png 640 × 480; 180 KB
-
CloseHomologCLUSTALWC11orf73.jpg 475 × 521; 95 KB
-
COL1A1 protein - PDB rendering based on 1y0f.jpg 294 × 371; 31 KB
-
Coronin-1a Secondary Structure From (DSSP).png 250 × 191; 35 KB
-
Corticosteroid-biosynthetic-pathway-rat.png 373 × 390; 34 KB
-
Cryo-EM structure of the human ether-a-go-go related K+ channel.png 640 × 480; 200 KB
-
CSNK1A1.png 1,920 × 975; 959 KB
-
CTSK protein.png 1,920 × 975; 404 KB
-
CXCL13.png 1,920 × 975; 239 KB
-
CXCL14.png 1,920 × 975; 662 KB
-
CXCR2.png 1,920 × 975; 258 KB
-
CXCR7aminoacidssec.png 897 × 648; 121 KB
-
CXorf66 - Peripheral blood mononuclear cells.png 624 × 445; 29 KB
-
CXorf66 Percent Non-identity vs Date of Divergence.png 1,044 × 454; 47 KB
-
CXorf66 STRING Predicted Protein Interactions.png 430 × 451; 104 KB
-
Cyanopyrrolidine and the binding site.png 651 × 355; 12 KB
-
Cyclophilin A-cyclosporin complex 1CWA.png 1,000 × 1,069; 368 KB
-
CYP24A1.png 1,920 × 975; 1.01 MB
-
CYR61 protein.png 1,920 × 975; 878 KB
-
DAXX prot.png 1,920 × 975; 577 KB
-
DCLRE1C.png 1,920 × 975; 573 KB
-
Descriptive Table of FAM76A Transcription Factors .png 565 × 741; 285 KB
-
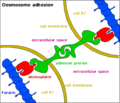
Desmosome - 2.png 486 × 419; 21 KB
-
DHFRfolateNADPH.png 312 × 351; 69 KB
-
DistantHomologCLUSTALWC11orf73.jpg 508 × 522; 115 KB
-
Distrofina.png 640 × 480; 149 KB
-
Divergence3.png 765 × 543; 27 KB
-
DJ1 protein.png 1,920 × 975; 291 KB
-
DNM2 protein.png 1,920 × 975; 804 KB
-
Domain features and regulation of CIC part A.png 1,947 × 439; 98 KB
-
Domain Locations in NBPF1.PNG 683 × 478; 57 KB
-
DSG2 protein.png 1,920 × 975; 743 KB
-
DSG3 protein.png 1,920 × 975; 375 KB
-
DUF4211 and possible nuclear signal in PRR12.PNG 587 × 293; 29 KB
-
DUF4662 in Human C22orf31 protein.jpg 602 × 193; 32 KB


