Category:Human genetic diversity
Jump to navigation
Jump to search
genetic differences in human populations | |||||
| Upload media | |||||
| Spoken text audio | |||||
|---|---|---|---|---|---|
| Subclass of | |||||
| |||||
Subcategories
This category has the following 29 subcategories, out of 29 total.
A
F
- Fixation index in humans (38 F)
G
H
- Human evolution maps (30 F)
I
M
- Maps of human eye color (14 F)
- Maps of human hair color (23 F)
- Human mutation rate (11 F)
O
P
R
- Race and genetics (13 F)
S
T
Media in category "Human genetic diversity"
The following 97 files are in this category, out of 97 total.
-
2ltivrk.jpg 813 × 224; 93 KB
-
A genetic atlas of human admixture history -dataset and tree.png 1,000 × 446; 172 KB
-
A genetic atlas of human admixture history -full.png 1,734 × 992; 201 KB
-
A Short History of the World, p0089.jpg 1,378 × 962; 251 KB
-
ADMIXTURE analysis at K8 ancestral components with global populations.jpg 2,300 × 1,197; 623 KB
-
ADMIXTURE world population.png 2,845 × 423; 944 KB
-
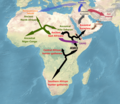
African phylogenetic structure projected on a map.png 2,881 × 2,505; 14.93 MB
-
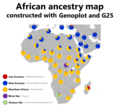
African population genomics ancestry map.png 2,948 × 2,736; 816 KB
-
Allentoft et al. 2024 PCA.webp 2,102 × 1,576; 283 KB
-
Ancestral population substructure of modern humans 30-15kya.png 4,376 × 2,480; 753 KB
-
Ancestry proportions for Sulawesi and North Moluccas.webp 2,121 × 657; 79 KB
-
Ancestry proportions of 1194 individuals.png 2,241 × 385; 421 KB
-
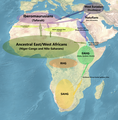
Ancient North African Iberomaurusian cline Afroasiatic origin model 2023.png 2,493 × 2,537; 11.4 MB
-
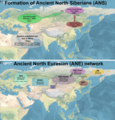
Ancient North Eurasian network.png 6,111 × 2,729; 29.56 MB
-
Ancient North Eurasians in context of West and East Eurasian Core populations.png 3,232 × 2,556; 6.25 MB
-
Ancient North Siberian and Ancient North Eurasian.png 5,104 × 5,344; 57.13 MB
-
ASEA map.png 3,157 × 1,591; 9.43 MB
-
Asia-Pacific Principal Component analysis.jpg 2,120 × 1,843; 625 KB
-
Box-and-whisker plot of human heterozygosity.png 1,273 × 1,278; 304 KB
-
Central Asian genetic makeup.jpg 988 × 4,255; 313 KB
-
Classical Multidimensional Scaling (MDS) analysis performed on the 1,719 samples.png 1,345 × 1,260; 420 KB
-
Consensus Neighbor-Joining Tree of Populations.png 4,180 × 3,350; 85 KB
-
Deep Tibetan admixture graph modeling.webp 1,350 × 1,478; 85 KB
-
Discerning the Origins of the Negritos, First Sundaland People.jpg 1,500 × 1,135; 152 KB
-
East-Eurasian phylogeny.png 5,337 × 2,877; 29.4 MB
-
Eurasian genetic ancestry components (K8).jpg 1,518 × 1,416; 405 KB
-
Eurasian genetic PCA centered on Central Asians.jpg 3,800 × 3,943; 1.51 MB
-
F1 large.jpg 1,316 × 1,052; 290 KB
-
F2 variant sharing across 1000 Genomes individuals.png 1,163 × 1,120; 1.21 MB
-
Genetic and Geographic Distance for Pairs of Human Populations.png 2,790 × 1,169; 383 KB
-
Genetic distances Eurasian West Asian East Asian.png 1,063 × 1,772; 1.64 MB
-
Genetic formation of modern Tajik people.jpg 3,637 × 2,136; 2.01 MB
-
Genetic history of Stone Age Eurasian.jpg 5,840 × 8,512; 16.71 MB
-
Genetic links between Tibeto-Burman speakers.webp 2,001 × 1,275; 142 KB
-
Genetic Variation.jpg 1,057 × 619; 231 KB
-
Genome-wide haplotype heterozygosities.png 4,131 × 1,907; 440 KB
-
Geographic location and dates of ancient individuals in Northern East Asia.png 1,715 × 1,761; 2.04 MB
-
Geographical distribution of human major genetic ancestral components.jpg 7,752 × 4,688; 9.46 MB
-
Human genetic ancestries (K4 - global).jpg 1,097 × 427; 109 KB
-
Human genetic diverging tree.jpg 685 × 456; 42 KB
-
Human genetic isolation by distance in Kanitz 2018.png 642 × 707; 92 KB
-
Human genetic variation.jpg 325 × 335; 38 KB
-
Individual-level human population structure.png 1,408 × 1,598; 645 KB
-
Individual-level human population structure2.png 829 × 623; 96 KB
-
Jomon ancestry of each region of Japan.jpg 3,371 × 1,809; 413 KB
-
Jomon and Continental Asian contributions to modern Japanese.jpg 996 × 996; 164 KB
-
K6 human genetic ancestries.png 1,498 × 1,642; 907 KB
-
Large-scale patterns of population structure.png 1,557 × 1,555; 1.69 MB
-
Location of troughs - human EEMS.png 1,952 × 1,267; 2.08 MB
-
Location of troughs by regions - human EEMS.png 1,513 × 2,500; 3.1 MB
-
Mean expected heterozygosity across 645 microsatellite loci.png 1,303 × 708; 357 KB
-
Migration routes of modern humans (2023).png 2,560 × 1,424; 693 KB
-
MtDNA genetic distance based MDS.png 1,255 × 1,460; 196 KB
-
PCA of masked South Asian ancestry models.jpg 1,080 × 1,605; 199 KB
-
PCA of the HGDP dataset plus the new JPT and Ecuadorian samples.jpg 697 × 633; 107 KB
-
PCA plot pf European populations in different number of loci.jpg 3,420 × 1,372; 570 KB
-
Phylogenetic relationship of the ESEA lineage.png 1,139 × 607; 37 KB
-
Phylogenetic structure of Africans.png 2,004 × 1,170; 960 KB
-
Phylogenetic structure of Eastern Eurasians.png 2,472 × 1,536; 1.45 MB
-
Phylogenetic structure of Western Eurasians.png 3,528 × 2,140; 1.86 MB
-
Phylogenetic tree for ancient Eurasians.png 1,492 × 776; 178 KB
-
Phylogeny of the ANEA ASEA lineages (detailed).png 1,027 × 605; 68 KB
-
Population relationships from genome-wide haplotypes.png 4,760 × 2,608; 1.22 MB
-
Population Structure of worldwide and India - cropped.png 4,043 × 546; 34 KB
-
Population structure within Asia.jpg 1,180 × 480; 122 KB
-
Principal component analysis of modern human populations.jpg 1,080 × 1,052; 154 KB
-
Procrustes-transformed PCA plot of genetic variation of worldwide populations.png 2,028 × 1,241; 290 KB
-
QpAdm model of Ulaanzuukh, Slab Grave and Xiongnu TAK and SBB individuals.jpg 3,000 × 1,616; 448 KB
-
Recent estimates of the human genome-wide mutation rate.png 935 × 654; 35 KB
-
Regional patterns of genetic diversity.png 1,275 × 1,563; 1.89 MB
-
Relationship and legacy of the West and East Eurasian Core populations.webp 2,000 × 1,688; 162 KB
-
Repetitive expansions into Eurasia from a population Hub OoA.jpg 2,513 × 5,081; 2.34 MB
-
Schematic depicting major ancestries in Asia.png 1,071 × 804; 595 KB
-
Scythian cultures and their genetic makeup.png 2,566 × 1,472; 8.73 MB
-
South Asian ancestry map (scaled).png 2,020 × 2,048; 631 KB
-
South Asian ancestry map.png 2,628 × 2,048; 600 KB
-
South Asian Indian ancestry components.png 970 × 945; 81 KB
-
South Asian PCA West-East cline.png 1,920 × 838; 561 KB
-
STRUCTURE analysis of the HapMap and HGDP-CEPH panels using 5,254 unlinked SNPs.png 4,134 × 5,078; 2.62 MB
-
Turkic languages and genetic makeup.png 2,372 × 1,063; 654 KB
-
Upper Paleolithic expansion (Western Eurasian).jpg 2,513 × 1,737; 1.03 MB
-
West Eurasian phylogenetic structure projected on a map.png 3,804 × 2,592; 18.28 MB
-
West-Eurasian Ancestry Large (global).png 2,560 × 1,714; 691 KB
-
West-Eurasian ancestry Large.png 1,144 × 849; 344 KB
-
Wikipedia - Human genetic variation (spoken by AI voice).mp3 36 min 21 s; 33.28 MB
-
World map showing DISTRUCT plots of ancestry profiles for 1484 humans samples.png 3,439 × 1,736; 1.3 MB
-
Worldwide Admixture structure.png 4,131 × 3,493; 1.17 MB
-
Worldwide human populations - frappe results.png 2,061 × 1,390; 815 KB
-
Worldwide human populations - PCA results.png 2,067 × 1,206; 429 KB


