Category:Holocene climate
Jump to navigation
Jump to search
| Paleogene | Neogene | Quaternary | ||||
|---|---|---|---|---|---|---|
| Paleocene | Eocene | Oligocene | Miocene | Pliocene | Pleistocene | Holocene |
Pages in category "Holocene climate"
This category contains only the following page.
Media in category "Holocene climate"
The following 136 files are in this category, out of 136 total.
-
1000 Jahr Temperaturen-Vergleich.png 599 × 442; 32 KB
-
1000 Year Temperature Comparison cs.png 2,496 × 1,966; 179 KB
-
1000 Year Temperature Comparison on SpringerImages.jpg 300 × 217; 34 KB
-
1000 Year Temperature Comparison.png 599 × 442; 32 KB
-
2000 Jahre Temperaturen-Vergleich.png 600 × 443; 56 KB
-
2000 Jaroj Temperatura Komparo.png 600 × 443; 71 KB
-
2000 Year Temperature Comparison cs.png 2,500 × 1,970; 155 KB
-
2000 Year Temperature Comparison es.png 600 × 443; 58 KB
-
2000 Year Temperature Comparison ro.png 600 × 450; 32 KB
-
2000 Year Temperature Comparison sr.png 600 × 443; 35 KB
-
2000 Year Temperature Comparison-es.png 600 × 443; 75 KB
-
2000 Year Temperature Comparison-fi.png 600 × 443; 34 KB
-
2000 Year Temperature Comparison-IT.png 1,449 × 1,088; 372 KB
-
2000 Year Temperature Comparison-template.png 600 × 443; 29 KB
-
2000 Year Temperature Comparison.png 1,449 × 1,088; 341 KB
-
202006 KaufmanEtAl Holocene Temp NH Bond.png 840 × 1,283; 415 KB
-
202006 KaufmanEtAl Holocene Temp-Fig3-de.png 1,245 × 1,111; 549 KB
-
Africa Climate 14000bp.png 1,320 × 1,320; 124 KB
-
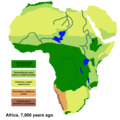
Africa Climate 7000bp.png 1,320 × 1,320; 210 KB
-
Arctice sea ice extent-de.svg 1,000 × 600; 177 KB
-
Bau future warming med.jpg 500 × 375; 26 KB
-
BondEvents-stacked-bond2001-labeled-de.svg 1,000 × 600; 43 KB
-
BondEvents-stacked-bond2001-labeled-en.svg 1,000 × 600; 43 KB
-
Carbon History and Flux.png 477 × 600; 23 KB
-
Changes in temperature Chinese holocene.PNG 1,352 × 727; 37 KB
-
Definitions MCA de.svg 1,676 × 753; 64 KB
-
Definitions MCA.svg 1,676 × 753; 64 KB
-
Early-anthopogenic-hypothesis-de.svg 1,768 × 1,043; 28 KB
-
Early-anthopogenic-hypothesis-en.svg 1,702 × 1,146; 28 KB
-
Egrip acidity 13000 0 bp 1.svg 1,196 × 557; 74 KB
-
Epica ice code delta t 12000-0 bp 1.svg 1,443 × 607; 43 KB
-
Epica ice code delta t 16000-0 bp 1.svg 1,412 × 612; 34 KB
-
Epica-vostok-grip-40kyr.png 761 × 245; 9 KB
-
Ghgs-epcia-holocene-CH4-de.svg 1,000 × 400; 81 KB
-
Ghgs-epcia-holocene-CH4-earlyanthropogenic-de.svg 1,000 × 400; 98 KB
-
Ghgs-epcia-holocene-CH4-en.svg 1,000 × 400; 81 KB
-
Ghgs-epcia-holocene-CO2-da.svg 1,000 × 400; 72 KB
-
Ghgs-epcia-holocene-CO2-de.svg 1,000 × 400; 96 KB
-
Ghgs-epcia-holocene-CO2-earlyanthropogenic-de.svg 1,000 × 400; 90 KB
-
Ghgs-epcia-holocene-CO2-en.svg 1,000 × 400; 72 KB
-
Ghgs-lawdome-2000yr-CH4-asof2010-de.svg 1,000 × 400; 67 KB
-
Ghgs-lawdome-2000yr-CH4-asof2010.svg 1,000 × 400; 67 KB
-
Ghgs-lawdome-2000yr-CO2-asof2010-de.svg 1,000 × 400; 69 KB
-
Ghgs-lawdome-2000yr-CO2-asof2010.svg 1,000 × 400; 69 KB
-
Ghgs-lawdome-2000yr-N2O-asof2010-de.svg 1,000 × 400; 65 KB
-
Ghgs-lawdome-2000yr-N2O-asof2010.svg 1,000 × 400; 65 KB
-
GISP2 ice core eng.svg 620 × 440; 28 KB
-
Glacier advances-de.svg 1,000 × 500; 31 KB
-
Glacier advances.svg 1,000 × 500; 31 KB
-
Greenland Gisp2 Temperature.svg 1,000 × 650; 79 KB
-
Greenland ice sheet temperatures interpreted with 18O isotope from 6 ice cores.png 1,500 × 1,125; 79 KB
-
Greenland ice sheet temperatures Vinther et al 2009.png 2,006 × 1,129; 472 KB
-
Holocene climate reconstructions and glacial-advance records from western Canada.png 1,571 × 2,098; 308 KB
-
Holocene Niveau Mer.png 512 × 364; 16 KB
-
Holocene Sea Level-es.svg 512 × 364; 31 KB
-
Holocene Sea Level-fr.svg 512 × 364; 25 KB
-
Holocene Sea Level.png 512 × 364; 22 KB
-
Holocene Temperature Variations German.png 600 × 400; 48 KB
-
Holocene Temperature Variations.png 600 × 400; 52 KB
-
Holocene-crop-domestication-de.svg 1,576 × 743; 252 KB
-
Holocene-crop-domestication-en.svg 1,613 × 743; 252 KB
-
Holocene-Pleniglacial.png 3,648 × 2,736; 115 KB
-
Holocene-Pleniglacial2-es.png 3,648 × 2,736; 335 KB
-
Holocene-Pleniglacial2.png 3,648 × 2,736; 217 KB
-
HoloceneTemperatureOfGreenland VintherEtAl2009-de.svg 1,000 × 600; 86 KB
-
HoloceneTemperatureOfGreenland VintherEtAl2009-en.svg 1,000 × 600; 87 KB
-
Journal.pone.0076514.g004-ar.png 4,156 × 3,950; 794 KB
-
Journal.pone.0076514.g004.png 4,156 × 3,950; 382 KB
-
Kopp2016 sealevel increaseByCentury de.svg 1,000 × 600; 33 KB
-
Kopp2016 sealevel increaseByCentury en.svg 1,000 × 600; 33 KB
-
Liestoehl firnline westNorway inPostglacialTimes.svg 2,557 × 1,276; 39 KB
-
LuterbacherEtAl-ERL2016-fig1.jpg 1,720 × 1,331; 1,001 KB
-
Mid-Holocene Warm Period - globe.gif 600 × 800; 147 KB
-
Ngrip 1yr data do18 ca 1 1000 ad 1.svg 1,472 × 609; 95 KB
-
Ngrip 1yr data do18 ca 1 2000 ad 1.svg 1,496 × 601; 39 KB
-
Ngrip 1yr data do18 ca 1 2000 ad 2.svg 1,496 × 601; 71 KB
-
Ngrip 1yr data do18 ca 1 2000 ad 3.svg 1,496 × 601; 82 KB
-
Ngrip 1yr data do18 ca 1 2000 ad 4.svg 1,471 × 601; 132 KB
-
Ngrip 1yr data do18 ca 1000 2000 ad 1.svg 1,459 × 604; 96 KB
-
Ngrip deltao18 10000 0 1.svg 1,448 × 659; 32 KB
-
Ngrip deltao18 10000 0 2.svg 1,448 × 659; 41 KB
-
Ngrip deltao18 12000 0 1.svg 1,448 × 659; 34 KB
-
Ngrip deltao18 12000 6000 bp 1.svg 1,448 × 659; 32 KB
-
Ngrip deltao18 12000 8000 1.svg 1,448 × 659; 28 KB
-
Ngrip deltao18 15000 0 1.svg 1,414 × 663; 33 KB
-
Ngrip deltao18 preboreal 11700 10500 1.svg 1,620 × 630; 161 KB
-
Ngrip deltao18 preboreal 12000 10000 1.svg 1,620 × 630; 202 KB
-
Ngrip yd pb do18 ch4 2.png 1,114 × 604; 120 KB
-
Ngrip1 deltao18 8400-8000 bp 1.svg 1,517 × 679; 63 KB
-
Ngrip20 yd pb 2.png 1,600 × 766; 207 KB
-
North atlantic oscillation-ortega2015-de.svg 1,000 × 600; 235 KB
-
North atlantic oscillation-ortega2015-en.svg 1,000 × 600; 235 KB
-
Pages2k stddev 1190-1970 SD.svg 535 × 336; 163 KB
-
Pbo2.jpg 985 × 647; 135 KB
-
Post-Glacial Sea Level-fr.svg 526 × 359; 24 KB
-
Post-Glacial Sea Level.png 1,813 × 1,088; 371 KB
-
Preboreal grip oxygen isotope curve 1.svg 923 × 607; 24 KB
-
Recent Sea Level Rise-fi.png 800 × 561; 111 KB
-
Recent Sea Level Rise-fr.svg 537 × 373; 54 KB
-
Recent Sea Level Rise-template.png 800 × 561; 103 KB
-
Recent Sea Level Rise.png 537 × 373; 47 KB
-
Reconstrucción de las temperaturas de los dos últimos milenios.svg 485 × 325; 106 KB
-
Sunspots 11000 years.jpg 721 × 388; 40 KB
-
Sunspots 11000 years.svg 1,360 × 700; 15 KB
-
T comp 61-90.pdf 875 × 660; 43 KB
-
T july northern fennoscandia 0 2000 ad 1.svg 1,516 × 630; 82 KB
-
Temp anomalies 2000yrs pages2k with 536-550 marked-de.svg 1,065 × 425; 3.5 MB
-
Temp anomalies 2000yrs pages2k-de.svg 1,065 × 425; 4.81 MB
-
Temp anomalies 2000yrs pages2k-en.svg 1,065 × 425; 4.8 MB
-
TempAndSnowAccumulation GISP2 Alley2000-de.svg 1,000 × 600; 96 KB
-
TempAndSnowAccumulation GISP2 Alley2000-en.svg 1,000 × 600; 78 KB
-
Temperature change of northern fennoscandia 1-2000 ad 2.svg 1,516 × 630; 84 KB
-
Temperature change of northern hemisphere 1-2000 ad 1.svg 1,477 × 583; 36 KB
-
Temperature reconstruction last two millennia cs.svg 485 × 325; 109 KB
-
Temperature reconstruction last two millennia-de.svg 484 × 350; 119 KB
-
Temperature reconstruction last two millennia.svg 485 × 325; 134 KB
-
Temperatuurvergelijking 2000 jaar.png 600 × 490; 70 KB
-
Variacions de temperatura a l'Holocè.png 600 × 409; 45 KB
-
Variazione orbitale.png 350 × 260; 16 KB
-
Volcanic forcing-reconstructed-de.svg 1,250 × 400; 126 KB
-
Volcanic forcing-reconstructed.svg 1,250 × 400; 179 KB
-
Wdc ice core summer deltad last 11000 years 1.png 1,617 × 826; 185 KB
-
Wdc ice core summer deltad last 6000 years 1.png 1,611 × 746; 175 KB
-
Wdc ice core winter deltad last 11000 years 1.png 1,532 × 725; 151 KB
-
Wdc ice core winter deltad last 4000 years 1.png 1,399 × 747; 162 KB
-
Wdc ice core winter deltad last 6000 years 1.svg 1,252 × 684; 359 KB
-
Yd pb boundary 2.svg 813 × 554; 57 KB
-
Younger Dryas-Preboreal boundary on Ngrip 50 dataset.png 1,527 × 797; 310 KB
-
Zeespiegel na Weichselien.jpg 782 × 400; 70 KB


