Category:Historical diagrams about the COVID-19 pandemic in Germany
Jump to navigation
Jump to search
Deutsch: Diagramme zur COVID-19 Pandemie in Deutschland, die in den letzten zwei Monaten nicht mehr aktualisiert wurden
English: Diagrams about the COVID-19 pandemic in Germany that haven't been updated since the last two month
Media in category "Historical diagrams about the COVID-19 pandemic in Germany"
The following 78 files are in this category, out of 78 total.
-
 NCoV20200306 Germany cases.png 800 × 700; 19 KB
-
 NCoV20200306 Germany cumulative.png 800 × 700; 17 KB
-
 Coronavirus deaths.png 2,935 × 1,761; 281 KB
-
 COVID Recovered Germany.png 2,000 × 1,500; 58 KB
-
 Coronavirus Germany cumulated logarithmic.png 1,164 × 757; 33 KB
-
 Coronavirus Germany cumulated.png 1,166 × 758; 33 KB
-
 COVID MX 30032020B.pdf 1,422 × 1,031; 50 KB
-
 Covid-19 Fälle Land Brandenburg 20-04-01-1600.pdf 1,752 × 1,239; 398 KB
-
 Covid-19 Fälle Land Brandenburg 20-04-02-1600.pdf 1,752 × 1,239; 407 KB
-
 Covid-19 Fälle Land Brandenburg 20-04-03-1600.pdf 1,752 × 1,239; 411 KB
-
 NCoV20200308 Deutschland je Tag.png 800 × 700; 20 KB
-
 NCoV20200308 Deutschland kumuliert.png 800 × 700; 19 KB
-
 BL Faelle Anteil.png 1,818 × 1,296; 55 KB
-
 Covid-19 Fälle Land Brandenburg 20-03-31-1600.pdf 1,752 × 1,239; 399 KB
-
 COVID-19-Spread-In-Baden-Württemberg-0227-0315.gif 432 × 463; 54 KB
-
 COVID Confirmed Cases and Deaths Germany.png 2,000 × 1,500; 84 KB
-
 COVID Deaths Germany.png 2,000 × 1,500; 62 KB
-
 COVID Confirmed Cases Germany.png 2,000 × 1,500; 87 KB
-
 Schätzung des (sekundären) Reproduktionsfaktors co19-01.png 800 × 571; 75 KB
-
 Co19mod.png 753 × 456; 56 KB
-
 COVID19-Deutschland-Datenanalyse-Aktuell.gif 1,104 × 701; 57 KB
-
 2020-04-20 RKI gleitenderSchnitt.jpg 1,211 × 681; 395 KB
-
 Covid19 TodesFälleInPPM Linear.png 1,283 × 617; 20 KB
-
 Covid19 TodesFälleInPPM Logari.png 1,283 × 617; 29 KB
-
 COVID-19 contact and exit restrictions in Germany, April 2020.svg 592 × 801; 111 KB
-
 EvolutionCoVid19Germany.png 816 × 605; 79 KB
-
 FälleEW.png 893 × 560; 148 KB
-
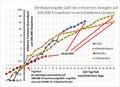
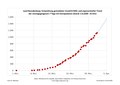
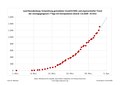
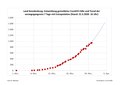
 Meldeverzug der (kumulierten) Zahl der positiv auf COVID-19 Getesteten.jpg 1,159 × 640; 282 KB
-
 Meldeverzug Neuinfizierte.jpg 940 × 635; 284 KB
-

-

-
 WHO Covid 2020 Jan-Aug daily C Germany.pdf 3,300 × 1,950; 26 KB
-
 Corona - Sterblichkeitsverlauf.gif 864 × 437; 25 KB
-
 CoViD-19 DE.svg 702 × 524; 76 KB
-
 BL Faelle Anteil Woche.png 1,771 × 1,417; 62 KB
-
 Corona Neuinfektionen in Deutschland 2020.png 1,571 × 694; 3.13 MB
-

-
 Covid-19-statistics-DE.jpg 4,601 × 1,061; 575 KB
-
 COVID-19-Pandemie - DE (Deutschland) - Infizierte (1200px).svg 1,200 × 450; 182 KB
-
 Übersterblichkeit Deutschland.png 403 × 316; 28 KB
-
 RKI BL Faelle Anteil Monat.png 1,771 × 1,417; 53 KB
-
 Diagramm-7-Tages-Inzidenz-nach-Altersgruppen-2021-02-09.png 2,395 × 1,281; 441 KB
-
 Grafisch gestalteter Stufenplan der STIKO zur Priorisierung der COVID-19-Impfung (4. Februar 2021) — Blatt 1.pdf 1,685 × 1,168, 2 pages; 109 KB
-
 GIF finden Infektionsrate (1).gif 1,200 × 900; 588 KB
-
 WHO Covid C Germany.pdf 3,300 × 1,950; 18 KB
-
 WHO Covid rn confirmed,deaths European Region03.pdf 3,300 × 1,950; 28 KB
-
 Daily CoViD DE.svg 886 × 531; 23 KB
-
 Nah-Zipf Tgl neu gemessene Infektionen COVID-19 Deutschland (Risklayer).svg 6,133 × 2,277; 60 KB
-
 Covid evolution-deu.svg 1,063 × 709; 51 KB
-
 Cumulative confirmed COVID-19 cases GER 20220112.svg 850 × 600; 50 KB
-
 Cumulative confirmed COVID-19 deaths GER 20220112.svg 850 × 600; 48 KB
-
 Daily new COVID-19 tests GER 20220112 OWID.svg 850 × 600; 47 KB
-

-

-

-

-
 Diagramm 7-Tage-Inzidenz COVID-19-Neuinfektionen Deutschland Risklayer.svg 10,397 × 3,273; 27 KB
-
 Diagramm tgl neue Todesfälle COVID-19 GER Risklayer.svg 10,396 × 3,216; 55 KB
-
 Gemessene COVID-19-Intensivpatienten in Deutschland (kumuliert; DIVI, Risklayer).svg 10,397 × 3,229; 33 KB
-
 Gemessene COVID-19-Neuinfektionen in Deutschland (kumuliert), Risklayer.svg 11,018 × 3,250; 35 KB
-
 Kumulierte Todesfälle COVID-19 GER Risklayer 001.svg 10,397 × 3,251; 34 KB
-
 PCR-Tests kumulativ GER COVID-19, Risklayer, RKI, ALM e.V.svg 10,396 × 3,251; 18 KB
-
 PCR-Tests positiv kumulativ GER COVID-19, Risklayer, RKI, ALM e.V.svg 10,396 × 3,251; 18 KB
-
 PCR-Tests positiv pro Woche GER COVID-19, Risklayer, RKI, ALM e.V.svg 10,397 × 3,037; 21 KB
-
 PCR-Tests Positivrate GER SARS-CoV-2, Risklayer, RKI, ALM e.V.svg 10,397 × 3,251; 17 KB
-
 PCR-Tests pro Woche GER COVID-19, Risklayer, RKI, ALM e.V.svg 10,397 × 3,226; 20 KB
-
 PCR-Tests pro Woche pro 1K EW GER COVID-19, Risklayer, RKI, ALM e.V.svg 10,396 × 3,251; 21 KB
-
 R-Wert COVID-19 Deutschland (Risklayer).svg 10,397 × 3,229; 24 KB
-

-

-
 Tage mit xy SARS-CoV-2-Infektionen (Risklayer).svg 10,397 × 3,251; 32 KB
-
 Täglich neu gemessene Infektionen COVID-19 in Deutschland Risklayer 001.svg 11,123 × 3,334; 55 KB
-
 1. + 2. Impfung gegen COVID-19 in Deutschland registriert (Risklayer).svg 10,397 × 3,270; 22 KB
-
 COVID-19-Inzidenz in Deutschland nach Lebensalter.svg 1,152 × 648; 166 KB
-
 COVID-19-assoziierte Todesfälle in Deutschland nach Alter und Geschlecht.png 1,349 × 695; 148 KB
-
 COVID-19-assoziierte Todesfälle in Deutschland nach Altersgruppen bis September 2022.png 1,867 × 1,017; 333 KB
-
-


_Reproduktionsfaktors_co19-01.png)


_Zahl_der_positiv_auf_COVID-19_Getesteten.jpg)


.gif)


_of_COVID-19_GER_20220112.svg)
_GER_20220112_OWID.svg)


_2020%E2%80%932021.png)
_bis_KW_21-2022.png)
_-_Infizierte_(1200px).svg)
.svg)
.svg)
,_Risklayer.svg)
.svg)
.svg)
.svg)