Category:Histograms
Jump to navigation
Jump to search
- (en) Histogram
- (da) Histogram
- (de) Histogramm
- (el) Ιστόγραμμα
- (es) Histograma
- (eu) Histograma
- (fi) Histogrammi
- (fr) Histogramme
- (he) היסטוגרמה
- (it) Istogramma
- (ja) ヒストグラム
- (ko) 히스토그램
- (mk) Хистограм
- (nl) Histogram
- (no) Histogram
- (pl) Histogram
- (pt) Histograma
- (ru) Гистограмма
- (sd) واقعنامو
- (simple) Histogram
- (sk) Histogram
- (su) Histogram
- (sv) Histogram
graphical representation of the bucketed distribution of numerical data  | |||||
| Upload media | |||||
| Spoken text audio | |||||
|---|---|---|---|---|---|
| Subclass of | |||||
| Part of | |||||
| Facet of | |||||
| Depicts | probability distribution | ||||
| |||||
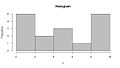
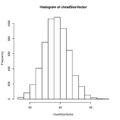
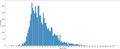
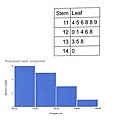
A histogram is a graphical display of tabulated frequencies. It shows what proportion of cases fall into each of several categories. A histogram differs from a bar chart in that it is the area of the bar that denotes the value, not the height, a crucial distinction when the categories are not of uniform width.
Subcategories
This category has the following 9 subcategories, out of 9 total.
- Horizontal histograms (11 F)
- Vertical histograms (324 F)
B
H
- Histograms with spacing (28 F)
I
L
- Letter frequency (42 F)
T
- Trellis histograms (7 F)
W
- Wikipedia histograms (22 F)
Pages in category "Histograms"
The following 2 pages are in this category, out of 2 total.
Media in category "Histograms"
The following 76 files are in this category, out of 76 total.
-
 1. Graph Gdp.jpg 499 × 500; 24 KB
-
 12985 2005 Article 81 Fig2 HTML.jpg 1,200 × 824; 104 KB
-
 12985 2019 1268 Fig6 HTML.webp 1,418 × 1,283; 459 KB
-
 12985 2019 1268 Fig9 HTML.webp 1,418 × 1,154; 401 KB
-
 2021-devsurvey-phabricator-histograms-engage-others.png 458 × 284; 16 KB
-
 2021-devsurvey-phabricator-histograms-file-bugs.png 389 × 284; 13 KB
-
 2021-devsurvey-phabricator-histograms-find-tasks.png 389 × 284; 15 KB
-
 2021-devsurvey-phabricator-histograms-satisfaction.png 389 × 284; 13 KB
-
 2021-devsurvey-phabricator-histograms-search.png 389 × 284; 14 KB
-
 2021-devsurvey-phabricator-histograms-workboards.png 389 × 284; 15 KB
-
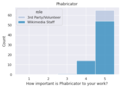 2021-devsurvey-phabricator-importance.png 389 × 284; 14 KB
-
 Base histogram.png 770 × 475; 6 KB
-
 Bildschirmfoto 2021-02-13 um 06.37.03.png 1,960 × 1,418; 6.1 MB
-
 BimodalAnts.png 2,000 × 1,333; 119 KB
-

-
-
 Cumulative vs normal histogram.png 1,600 × 800; 50 KB
-
 Daily walking in 2015 - Flickr - brewbooks.jpg 1,144 × 858; 68 KB
-
 Densityhisto.jpg 648 × 382; 29 KB
-
 Exemplo FIFO.png 640 × 480; 20 KB
-
 Figure 10 volunteering trajectories 1 (Where experts and amateurs meet).png 1,392 × 661; 46 KB
-
 Figure 11 volunteering trajectories 2 (Where experts and amateurs meet).png 1,305 × 587; 42 KB
-
 Figure 9 wikipedia reliability (Where experts and amateurs meet).png 1,399 × 587; 33 KB
-
 Fmicb-10-01003-g002.jpg 2,989 × 4,307; 1.2 MB
-
 Fyre Histogram 22.39067 Computation A,B,C,D.png 600 × 348; 63 KB
-
 Fyre Histogram 22.39067 Computation A.png 600 × 348; 125 KB
-
 Gimp-histogram-logarithmic.svg 16 × 16; 6 KB
-
 Halloween storyline continuity histogram by film.svg 750 × 975; 117 KB
-
 Histarman2.jpg 756 × 430; 31 KB
-
 Histogram chestsize vector.pdf 1,050 × 1,050; 5 KB
-
-
 Histogram explanation (vysvětlení histogramu).png 573 × 472; 23 KB
-
 Histogram for FPC.png 273 × 127; 7 KB
-
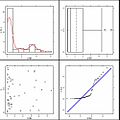
 Histogram image against itself and spatially shifted.jpg 512 × 713; 44 KB
-
 Histogram of DNP (dinitrophenol) doses reported on online forums.png 1,699 × 1,290; 168 KB
-

-
 Histogram of Piazzetta dalmata nudo.jpg 470 × 395; 33 KB
-
 Histogram of relative frequencies.jpg 1,307 × 1,031; 78 KB
-
 Histogram zscore.pdf 1,050 × 1,050; 5 KB
-
 Histograma de um conjunto.png 800 × 600; 12 KB
-
 Histogramm.png 431 × 378; 12 KB
-
 Joint histograms for spatially shifted images.jpg 533 × 742; 47 KB
-
 Kolmogorow Smirnow Test ZweistichprobenBeispiel.png 1,252 × 489; 36 KB
-
 LDA Projection Illustration 01.gif 640 × 480; 501 KB
-
 Luminosity histogram.jpg 312 × 332; 52 KB
-
 Matplotlib histogram.png 1,600 × 865; 15 KB
-
 Matplotlib3 histogram.svg 576 × 432; 15 KB
-
 Minerals-06-00010-g008.webp 2,397 × 2,350; 1.88 MB
-
 Minerals-06-00010-g010.webp 2,533 × 1,422; 1.23 MB
-
 Normal pnormGC.pdf 1,050 × 1,050; 6 KB
-
 Odd-eyed cat histogram.png 768 × 300; 3 KB
-
 Ogiva polinomial.svg 411 × 266; 17 KB
-
 ORES-fawiki-ip-damaging-edits.png 597 × 422; 5 KB
-
 ORES-fawiki-ip-goodfaith-edits.png 597 × 422; 5 KB
-
 ORES-fawiki-newbie-damaging-edits.png 597 × 422; 5 KB
-
 ORES-fawiki-newbie-goodfaith-edits.png 597 × 422; 6 KB
-
 Origin histogram dados ordenados.png 504 × 345; 23 KB
-
 Origin histogram raw data.png 499 × 342; 23 KB
-
 Origin histograma raw data.png 499 × 347; 23 KB
-
 Pareto histogram.png 273 × 273; 1 KB
-
 PCA Projection Illustration.gif 640 × 480; 533 KB
-
 Polymers-14-05407-g001a.png 2,837 × 3,566; 1.12 MB
-
 PRODUK PLASTIK SPC DISTRIBUSI NORMAL.gif 807 × 404; 24 KB
-
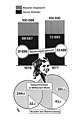
 PSUV votos respuesta.png 432 × 432; 4 KB
-
 R histogram sample mean.pdf 1,050 × 1,050; 5 KB
-
 R histogram uniform distribution.pdf 1,050 × 1,050; 5 KB
-
 Sample histogram.gif 527 × 414; 4 KB
-
 Sample Histograms Showing Results of a Simulation Run.jpg 962 × 353; 48 KB
-
 Seiyu age hist EN.png 1,754 × 710; 50 KB
-
 Seiyu age hist RU.png 1,752 × 705; 53 KB
-
 SpaceDebrisHistogram.png 945 × 567; 61 KB
-
 Stem and leaf plot and histogram.jpg 1,267 × 1,324; 112 KB
-
 Stem-and-leaf plot and histogram of data set.jpg 1,517 × 1,451; 119 KB
-
 Styled 2D Histogram Contour.jpg 1,913 × 709; 170 KB
-
Typical-length-of-a-document-Histograms.webm 7 min 39 s, 1,920 × 1,080; 28.88 MB
-
 Walked 3008 miles in 2014 - Flickr - brewbooks.jpg 1,160 × 853; 62 KB


.png)
.png)
.png)


.png)


_doses_reported_on_online_forums.png)


