Category:Gross domestic product bar charts
Jump to navigation
Jump to search
Media in category "Gross domestic product bar charts"
The following 84 files are in this category, out of 84 total.
-
2000-2011中国GDP增长率.jpg 1,000 × 438; 101 KB
-
2010 Nominal GDP.jpg 470 × 278; 19 KB
-
BERD as a share of GDP in the EU, 2005 and 2013.svg 501 × 357; 2.34 MB
-
BIP Wachstum China.png 532 × 245; 9 KB
-
BIP Wachstum EU.png 892 × 691; 18 KB
-
BIP Wachstum USA.png 512 × 235; 7 KB
-
Canada GDP.jpg 718 × 429; 45 KB
-
Composition of GDP in sub-Saharan Africa by economic sector, 2013.svg 647 × 894; 1.04 MB
-
DebtGDPUkraine.PNG 861 × 628; 70 KB
-
Democratic Republic of the Congo GDP evolution-fr.svg 730 × 504; 313 KB
-
Econ collapse.png 894 × 368; 8 KB
-
Ee real gdp growth-2.svg 1,350 × 900; 47 KB
-
Ee real gdp growth.svg 1,350 × 900; 44 KB
-
EU-GDP-PPP-pc.png 955 × 653; 20 KB
-
EU-GDP-PPP.png 955 × 653; 19 KB
-
European union gdp diagram de.png 500 × 620; 9 KB
-
European-union-gdp-diagram-de.svg 1,450 × 1,400; 6 KB
-
Eurostat GNP EU28 Finland.png 542 × 360; 38 KB
-
Evolucao pib 1995-2014.jpg 1,621 × 852; 286 KB
-
Fi real gdp growth.svg 1,350 × 900; 42 KB
-
GDP 2006 en.svg 481 × 333; 67 KB
-
Gdp accumulated change.png 1,100 × 614; 77 KB
-
GDP by economic sector in the CARICOM countries 2012.svg 243 × 357; 2.93 MB
-
GDP by Province.jpg 1,916 × 1,108; 145 KB
-
GDP from the IMF 2012.png 1,010 × 507; 23 KB
-
GDP in Central Asia by economic sector, 2005 and 2013.svg 316 × 764; 1.06 MB
-
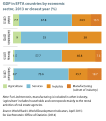
GDP in EFTA countries by economic sector, 2013 or closest year.svg 237 × 269; 1.32 MB
-
GDP nominal 2010 2050.jpg 478 × 285; 19 KB
-
GDP per capita 2006.svg 480 × 335; 74 KB
-
GDP per capita and GDP growth rate for Brazil, 2003–2013.svg 497 × 271; 4.67 MB
-
GDP per economic sector in South Asia, 2013.svg 252 × 384; 1 MB
-
GDP per head Europe 1937.png 817 × 646; 43 KB
-
GDP-PPP By Country.jpg 960 × 720; 64 KB
-
GDP-PPP per Capita by country.png 773 × 492; 23 KB
-
GDP-top-counties.gif 531 × 311; 28 KB
-
GDPgrowthrates1q2015.png 758 × 423; 63 KB
-
General government net lending of Hungary 2005-2010.png 970 × 601; 18 KB
-
GERD GDP ratio in East and Central Africa, 2013, or closest year.svg 315 × 295; 764 KB
-
Growth rate of Indian GDP and employment.jpg 2,788 × 1,296; 731 KB
-
HDP CZ.png 657 × 347; 4 KB
-
Hu real gdp growth.svg 867 × 578; 7 KB
-
InterestRGrowthDiff.PNG 959 × 593; 37 KB
-
Islamabad Contribution to Pakistan.jpg 479 × 338; 21 KB
-
Japan real GDP growth rate.png 979 × 601; 6 KB
-
LA-GDP-PPP.png 854 × 584; 16 KB
-
LA-GNI-pc-PPP.png 854 × 584; 16 KB
-
Lt real gdp growth.svg 867 × 723; 8 KB
-
Lv real gdp growth.svg 1,084 × 867; 8 KB
-
Nominal GDP IMF 2008 millions of USD.jpg 531 × 311; 27 KB
-
OECD Productivity levels 2007.svg 1,600 × 939; 458 KB
-
OECDWachst.PNG 970 × 604; 26 KB
-
Per capita GDP of South Asian economies & SKorea (1950-1995).png 769 × 464; 38 KB
-
Per capita GDP of South Asian economies & SKorea (1950-1995).svg 1,278 × 631; 143 KB
-
Per capita GDP of South Asian economies.png 1,782 × 1,070; 393 KB
-
Pib em dólares 1962-2014.jpg 1,524 × 630; 209 KB
-
PIB España 2000-2009.png 512 × 396; 12 KB
-
PIB par Etats et USA 2004-2006.svg 513 × 373; 89 KB
-
PNB 2006-fr.svg 481 × 333; 66 KB
-
PNB par habitants 2006.svg 480 × 335; 73 KB
-
Polish GDP.PNG 444 × 238; 6 KB
-
PPP GDP IMF 2008 millions of USD.jpg 479 × 286; 21 KB
-
Pppgdp vers gdp in oecd en.svg 548 × 588; 39 KB
-
Real GDP growth rates RS & FBH sr.png 1,031 × 608; 29 KB
-
Real GDP growth rates RS & FBH.png 1,031 × 608; 30 KB
-
Share of Global GDP.gif 538 × 460; 90 KB
-
ShortIntRGrowthDiff.PNG 970 × 604; 37 KB
-
Sw real gdp growth.svg 867 × 578; 8 KB
-
Tcreceesp.jpg 1,871 × 985; 244 KB
-
Top 20 BBP.PNG 650 × 575; 27 KB
-
Top 20 GDP.png 650 × 562; 30 KB
-
Top 25 GDP PPP ua.png 621 × 667; 29 KB
-
Trends in GDP per capita and GDP growth in China, 2003–2014.svg 608 × 449; 231 KB
-
United States GDP by States.png 697 × 962; 113 KB
-
Uzbekistan GDPgrowth1992-2008 cropped.jpg 1,412 × 910; 163 KB
-
West BankGDP4.png 722 × 509; 15 KB
-
World GDP Capita 1-2003 A.D.png 941 × 742; 13 KB
-
Zim GDP per capita 1980-2010.svg 600 × 423; 105 KB
-
Zimbabwe GDP per cap 2015.png 4,631 × 2,826; 654 KB
-
ZinsWachsDiff.PNG 959 × 593; 21 KB
-
Évolution PIB an 1 à 2003.jpg 1,026 × 727; 66 KB
-
Évolution PIB par habitant an 1 à 2003.jpg 1,037 × 787; 53 KB


