Category:Graphs of political parties in the United States
Jump to navigation
Jump to search
Subcategories
This category has the following 10 subcategories, out of 10 total.
A
C
G
L
Media in category "Graphs of political parties in the United States"
The following 13 files are in this category, out of 13 total.
-
 Development of Political Parties in the United States.svg 512 × 843; 1.78 MB
-
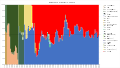
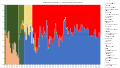 Historical distribution of parties in US House of Representatives.svg 5,487 × 3,093; 130 KB
-
 PartyVotes-Presidents.png 1,580 × 700; 43 KB
-
 PartyVotes-PresidentsWhoHadBeenVicePresidents.png 1,530 × 700; 81 KB
-
 PartyVotes.png 1,555 × 664; 22 KB
-
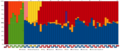
 Political Parties in the U.S. House of Representatives.png 1,907 × 821; 73 KB
-
 Political Party Affiliations in the US - 2014.png 1,160 × 790; 72 KB
-
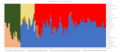
 SenateSVG.svg 5,487 × 3,093; 141 KB
-
 Two party system diagram.png 640 × 480; 54 KB
-
 U.S. party affiliation.jpg 335 × 358; 78 KB
-
 U.S. party affiliation.png 400 × 400; 18 KB
-
 US Presidential Elections by Popular Vote he.svg 3,650 × 1,320; 1.04 MB
-
 US Presidential elections popular votes since 1900.png 1,336 × 551; 20 KB


