Category:Graphics from WIPO IP Facts and Figures 2018
Jump to navigation
Jump to search
Media in category "Graphics from WIPO IP Facts and Figures 2018"
The following 26 files are in this category, out of 26 total.
-
 1. Total applications worldwide.png 2,728 × 2,473; 82 KB
-
 10. Top 10 PCT applicants.png 2,710 × 3,269; 75 KB
-
 11. Utility model applications for the top 10 offices.png 2,662 × 3,077; 86 KB
-
 12. Utility model applications for offices of selected middle-income countries.png 2,654 × 2,832; 79 KB
-
 13. Percentage shares of total trademark filing activity by the top five offices.png 2,655 × 1,913; 61 KB
-
 14. Application class counts for the top 10 offices.png 2,640 × 2,684; 78 KB
-
 15. Application class counts for offices of selected middle-income countries.png 2,667 × 2,863; 78 KB
-

-
 17. The top three industry sectors for each of the top five origins.png 2,648 × 2,768; 85 KB
-
 18. Madrid international applications for the top 10 origins.png 2,623 × 2,859; 75 KB
-
 19. Top 10 Madrid applicants.png 2,728 × 3,273; 75 KB
-
 2. Percentage shares of IP filing activity by region.png 2,706 × 3,833; 103 KB
-
 20. Percentage shares of total design filing activity by the top five offices.png 2,691 × 1,953; 63 KB
-
 21. Application design counts for the top 10 offices.png 2,706 × 3,173; 91 KB
-
 22. Application design counts for offices of selected middle-income countries.png 2,763 × 2,863; 83 KB
-
 23. Resident application design count relative to GDP for the top 10 origins.png 2,626 × 2,600; 64 KB
-
 24. The top three industry sectors for each of the selected origins.png 2,706 × 2,523; 86 KB
-
 25. Designs in Hague international applications for the top 10 origins.png 2,684 × 2,824; 79 KB
-
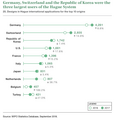
 26. Top 10 Hague applicants.png 2,765 × 4,132; 87 KB
-
 3. IP rights in force.png 2,695 × 2,073; 55 KB
-
 4. Percentage shares of total patent applications by the top five offices.png 2,622 × 1,906; 57 KB
-
 5. Patent applications for the top 10 offices.png 2,697 × 3,216; 93 KB
-
 6. Patent applications for offices of selected middle-income countries.png 2,658 × 3,068; 89 KB
-
 7. Resident patent applications relative to GDP for the top 10 origins.png 2,684 × 2,688; 66 KB
-
 8. The top three technology fields for each of the top five origins, 2014-2016.png 2,727 × 3,470; 104 KB
-
 9. PCT international applications for the top 10 origins.png 2,675 × 2,933; 75 KB


