Category:Global warming maps of the world with subnational resolution
Jump to navigation
Jump to search
Media in category "Global warming maps of the world with subnational resolution"
The following 104 files are in this category, out of 104 total.
-
 16-008-NASA-2015RecordWarmGlobalYearSince1880-20160120 (120k-edited).png 400 × 225; 119 KB
-
 16-008-NASA-2015RecordWarmGlobalYearSince1880-20160120.png 1,920 × 1,080; 2.22 MB
-
1880- Global surface temperature - heat map animation - NASA SVS.webm 30 s, 3,840 × 2,160; 35.15 MB
-
 2006 temp anom.png 456 × 604; 48 KB
-
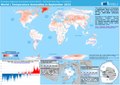
 2014 Annual Temperature Local Records.jpg 2,700 × 1,555; 773 KB
-
 2015 Annual Temperature Local Records.jpg 2,509 × 1,446; 929 KB
-
A Year In The Life Of Earth's CO2 11719-1920-MASTER.webm 3 min 10 s, 1,920 × 1,080; 460.44 MB
-
 AIRS Methane.png 2,733 × 1,528; 3.16 MB
-
-
-
-
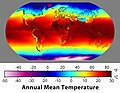 Annual Average Temperature Map.jpg 1,100 × 849; 385 KB
-
 Annual Average Temperature Map.png 8,640 × 4,320; 10.16 MB
-
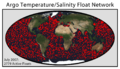 Argo Float Network.png 1,100 × 636; 168 KB
-
 Atmospheric Temperature Trend.jpg 610 × 600; 73 KB
-
 Atmospheric Temperature Trends, 1979-2005.jpg 540 × 592; 115 KB
-
 Average Seasonal Temperature Range.png 8,640 × 4,320; 4.37 MB
-
 AYool GLODAP del co3.png 1,667 × 1,133; 243 KB
-
 AYool GLODAP del pH ro.png 1,683 × 1,133; 95 KB
-
 AYool GLODAP del pH.png 1,683 × 1,133; 232 KB
-
 Change in Average Temperature (squared).png 700 × 700; 692 KB
-
 Change in Average Temperature mk.svg 960 × 816; 313 KB
-
 Change in Average Temperature With Fahrenheit.svg 960 × 864; 236 KB
-
 Change in Average Temperature zh.png 1,500 × 1,400; 1.9 MB
-
 Change in Average Temperature-ar.svg 960 × 816; 709 KB
-
 Change in Average Temperature-cs.svg 960 × 816; 317 KB
-
 Change in Average Temperature-vi.svg 960 × 864; 306 KB
-
 Change in Average Temperature.png 1,500 × 1,260; 2.17 MB
-
 Change in Average Temperature.svg 960 × 816; 235 KB
-
 Changement de la température moyenne.svg 960 × 864; 296 KB
-
 Changement prévu des températures d'ici 2090 AR6.svg 960 × 960; 1.07 MB
-
 Changement prévu des températures d'ici 2090.svg 960 × 960; 1.74 MB
-

-
 CLIMAP - non-language.PNG 703 × 428; 222 KB
-
 CLIMAP.jpg 650 × 472; 124 KB
-
 Contrails Climate change atmos-chem-phys.net 19 8163 2019 acp-19-8163-2019-f02.jpg 2,067 × 4,438; 951 KB
-
 Daily Temperature Range.png 8,640 × 4,320; 4.53 MB
-
 ECDM 20221017 World Temperature Anomaly September2022.pdf 2,481 × 1,754; 688 KB
-
Five-year average global temperature anomalies from 1880 to 2010.ogv 26 s, 1,280 × 720; 29.32 MB
-

-
 GHCN Temperature Stations.png 900 × 595; 82 KB
-
 GISS temperature 2000-09.png 1,078 × 626; 432 KB
-
 Glacier Mass Balance Map (pt).png 650 × 477; 94 KB
-
 Glacier Mass Balance Map (Zh-hans).png 650 × 477; 114 KB
-
 Glacier Mass Balance Map (Zh-hant).png 650 × 477; 115 KB
-
 Glacier Mass Balance Map German.png 650 × 477; 35 KB
-
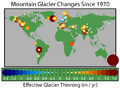 Glacier Mass Balance Map.png 650 × 477; 75 KB
-
 Global forest, cropland and pasture, rangeland change.webp 1,971 × 2,538; 665 KB
-
Global Temperature Anomalies from 1880 to 2019.webm 33 s, 1,920 × 1,080; 34.58 MB
-
Global Temperature Anomalies from 1880 to 2021 in °C.webm 30 s, 1,920 × 1,080; 9.31 MB
-
Global Temperature Anomalies from 1880 to 2022.webm 30 s, 1,920 × 1,080; 8.49 MB
-
 Global Temperature Anomaly - slower-1000.gif 1,280 × 720; 19.74 MB
-
 Global Temperature Anomaly - slower-200.gif 1,280 × 720; 19.75 MB
-
 Global Temperature Anomaly - slower-2000.gif 1,280 × 720; 19.74 MB
-
 Global Temperature Anomaly - slower-300.gif 1,280 × 720; 19.75 MB
-
 Global Temperature Anomaly - slower-400.gif 1,280 × 720; 19.75 MB
-
 Global Temperature Anomaly - slower-500.gif 1,280 × 720; 19.74 MB
-
 Global Temperature Anomaly Kelvin.gif 1,280 × 720; 20.1 MB
-
 Global Temperature Anomaly.gif 1,280 × 720; 19.77 MB
-
Global temperature changes.webm 37 s, 3,840 × 2,160; 60.66 MB
-
 Global Warming Map-fi.jpg 571 × 406; 85 KB
-
 Global Warming Map-gl.png 800 × 596; 453 KB
-
 Global Warming Map-he.jpg 800 × 596; 80 KB
-
 Global Warming Map-tgk.png 571 × 406; 217 KB
-
 Global Warming Map.es..png 800 × 596; 425 KB
-
 Global Warming Map.jpg 800 × 596; 212 KB
-
 IPCC2007 Temperature Change Worldmap.svg 940 × 477; 1.9 MB
-
 Klimazonen-Prognose.gif 800 × 448; 390 KB
-
 Land and Ocean Temperature Departure from Average 2018 NOAA NCEI.gif 1,052 × 743; 135 KB
-
 Landmass Lost with Complete Polar Ice Melt (9558702416).jpg 4,096 × 2,048; 1.34 MB
-
 Localisation de la zone d'étude.jpg 1,385 × 980; 249 KB
-
 Major cities threatened by sea level rise.png 1,425 × 625; 29 KB
-
 Map global warming 2010-2019.png 770 × 488; 115 KB
-

-

-
-

-
 Mapa globalnej temperatury.JPG 571 × 406; 47 KB
-
 Mapa globalnej temperatury2.jpg 800 × 596; 206 KB
-
 Mapa temperatury globalnej.svg 1,079 × 675; 687 KB
-
 Mapa-zmeny-teploty.svg 1,052 × 744; 1.21 MB
-
NASA Global Temperature change from 1880 to 2013 high quality.webm 27 s, 1,920 × 1,080; 15.56 MB
-
NASA Global Temperature change from 1880 to 2013.webm 27 s, 1,920 × 1,080; 3.05 MB
-
 Opwarming van de Aarde map.png 774 × 522; 86 KB
-
 Pagbabago sa Katamtamang Temperatura.svg 960 × 864; 244 KB
-
 Possible impact of Climate Change on the Mean Annual Temperature.png 6,549 × 2,695; 890 KB
-
 Prognoza świat.JPG 559 × 408; 45 KB
-
-

-
 Projected Change in Temperatures by 2090-vi.svg 960 × 960; 1.75 MB
-
 Projected Change in Temperatures by 2090.png 1,500 × 1,500; 1.85 MB
-
 Projected Change in Temperatures-cs.svg 960 × 960; 1.08 MB
-
 Projected Change in Temperatures.svg 960 × 960; 1.07 MB
-
-

-
 RF-Airtraffic-Acp-19-8163-2019-f02-C2006T06.jpg 2,067 × 1,282; 1.11 MB
-
 Sea Surface Temps (14113579269).png 1,360 × 1,278; 686 KB
-
 Spatial extent of global land use- & land-cover change.webp 1,790 × 810; 249 KB
-
 STAR TTS SSU Trend.png 1,813 × 1,010; 5.25 MB
-
 Temperature anomalies 2000s.svg 1,024 × 768; 606 KB
-
 Van der Wiel ru.jpg 1,279 × 699; 219 KB
-
-
 Átlaghőmérséklet a Földön.jpg 1,100 × 827; 208 KB
-
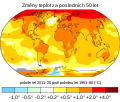
 שינויי טמפרטורה בכדור הארץ ב-50 השנים האחרונות.png 1,280 × 720; 739 KB
.png)


.png)


.png)


_showing_the_distribution_of_sea_surface_temperature_observations_since_1860.webp)


.png)
.png)
.png)


.jpg)


.jpg)
.jpg)
.jpg)
.jpg)


.png)


.png)


