Category:German-language SVG charts
Jump to navigation
Jump to search
Subcategories
This category has only the following subcategory.
*
Media in category "German-language SVG charts"
The following 200 files are in this category, out of 254 total.
(previous page) (next page)-
01 Graph Mean Median Income SE 2004-2017 EUSILC.svg 512 × 284; 22 KB
-
01 Graph SE Mean Median Income 2004-2017 EUSILC.svg 512 × 284; 22 KB
-
01 Mean Median Income SE 2009-2017 EUSILC.svg 512 × 284; 21 KB
-
02 Graph SE GINI Eurostat.svg 512 × 284; 17 KB
-
03 Graph SE EU27 Top10 2005-2017 EUSILC.svg 512 × 284; 15 KB
-
04 Graph SE S80S20 2004-2017 EUSILC.svg 512 × 284; 16 KB
-
05 Graph SE EU27 GPG 2007-2017 EUSILC.svg 512 × 284; 14 KB
-
18. Deutscher Bundestag nach beruflicher Herkunft.svg 1,132 × 642; 19 KB
-
Absolute configuration.svg 1,280 × 1,280; 14 KB
-
Absolute-relative-entkopplung.svg 575 × 431; 39 KB
-
AD-Kurve.svg 800 × 600; 6 KB
-
Alcala de Henares population growth.svg 700 × 493; 37 KB
-
Althing 2009-de.svg 1,601 × 580; 96 KB
-
AmdahlsLaw german.svg 640 × 500; 4 KB
-
AminoAcid length distribution 2010.svg 844 × 314; 74 KB
-
Ammoniakproduktion.svg 534 × 396; 36 KB
-
Angriffe Antibiotika.svg 512 × 419; 94 KB
-
Ankünfte in EU über Mittelmeer ab 2008.svg 1,728 × 878; 46 KB
-
Arabic numerals-de.svg 397 × 142; 44 KB
-
Arctice sea ice extent-de.svg 1,000 × 600; 177 KB
-
Armutsgefaerdung verbessert FR 2012-2017 EUROSTAT.svg 512 × 284; 7 KB
-
Badesee Rodgau Besucherentwicklung.svg 852 × 431; 48 KB
-
Besucher.svg 459 × 450; 33 KB
-
Betreuungsmittelwert HessKifoeg 25c 2014.svg 800 × 650; 203 KB
-
Bilanz der Wärmepumpe.svg 744 × 1,052; 32 KB
-
BMI de.svg 945 × 525; 30 KB
-
Bruttoinlandsprodukt Deutschland - Verwendung 2013.svg 832 × 496; 31 KB
-
Bruttowertschöpfung 2007.svg 800 × 350; 45 KB
-
Bundestagswahlen seit 1949 Nichtwähleranteile Ausschöpfungsquoten.svg 1,234 × 720; 95 KB
-
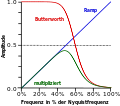
ButterworthFilter60Percent5thOrder-de.svg 670 × 590; 243 KB
-
Carnot Wirkungsgrad.svg 503 × 411; 29 KB
-
Cash percent of GDP India BRICS 2015.svg 743 × 400; 9 KB
-
Clune2016 food lca-de.svg 1,000 × 800; 49 KB
-
Cmbr.svg 600 × 480; 18 KB
-
Cone Solid Angle.svg 600 × 480; 10 KB
-
Cone-absorbance-de.svg 550 × 346; 15 KB
-
COVID-19 Austria.svg 1,057 × 980; 7 KB
-
COVID-19 Health care limit.svg 1,249 × 582; 6 KB
-
D(A) Inhalation.svg 512 × 384; 124 KB
-
D(t A-m2) Cs137 I131.svg 512 × 384; 135 KB
-
D(t-1Bq) Inhalation.svg 512 × 384; 110 KB
-
D(t-A(d)) Ingestion Cs137.svg 512 × 384; 51 KB
-
D(t-A-Konz I131-Cs137) Inhalation.svg 512 × 384; 98 KB
-
De wanderung.svg 600 × 300; 29 KB
-
Divestment growth de.svg 1,200 × 600; 42 KB
-
DMAX market share 2006 to 2014 (de).svg 774 × 517; 67 KB
-
Drogen-schadenspotenzial-nutt-2010.svg 898 × 736; 210 KB
-
Drug danger and dependence-de.svg 870 × 417; 20 KB
-
Einkommensquintilverhältnis Geschlecht.svg 512 × 284; 11 KB
-
Einkommensteuer A 2016 vs 2009.svg 720 × 720; 116 KB
-
Einkommensteuer A 2022 vs 2009.svg 720 × 720; 134 KB
-
Einwohner Uslar.svg 1,079 × 526; 113 KB
-
Einwohnerentwicklung Dansenberg 1705-2001.svg 400 × 200; 47 KB
-
Einwohnerentwicklung von Barntrup.svg 800 × 400; 36 KB
-
Einwohnerentwicklung von Clausthal-Zellerfeld.svg 800 × 400; 58 KB
-
Einwohnerentwicklung von Grevenbroich - ab 1871.svg 800 × 400; 50 KB
-
Einwohnerentwicklung von Grevenbroich.svg 800 × 400; 49 KB
-
Einwohnerentwicklung von Kundert.svg 800 × 400; 50 KB
-
Einwohnerentwicklung von Neu-Ulm.svg 800 × 400; 51 KB
-
Einwohnerentwicklung von Niederweis.svg 800 × 400; 64 KB
-
Einwohnerentwicklung von Weingarten (Württemberg) (log10).svg 800 × 400; 70 KB
-
Einwohnerentwicklung von Weingarten (Württemberg) - ab 1871.svg 800 × 400; 50 KB
-
Einwohnerentwicklung von Weingarten (Württemberg).svg 800 × 400; 60 KB
-
Electricity in France de Gnuplot.svg 800 × 400; 47 KB
-
Electricity in France de.svg 1,800 × 900; 10 KB
-
Elemental abundances-de.svg 820 × 600; 8 KB
-
Energieerzeugung in Taiwan seit 2001.svg 655 × 438; 19 KB
-
Energieverbrauch Deutschland.svg 750 × 420; 12 KB
-
Entwicklung Erwerbstätige Arbeitsvolumen Vollzeitäquivalente D.svg 985 × 733; 22 KB
-
Entwicklung Realohn Nominallohn Verbraucherpreisindex D.svg 768 × 432; 64 KB
-
Environmental-Kuznets-Kurve-deutsch.svg 575 × 431; 40 KB
-
Erdölfördermenge pro Jahr (1965-2007).svg 419 × 295; 38 KB
-
Ertragsgesetz.svg 857 × 505; 10 KB
-
Exergy anergie DE.svg 670 × 588; 19 KB
-
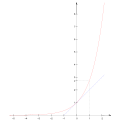
Exponentialfunktion.svg 450 × 473; 44 KB
-
Fildertunnelgradiente2.svg 663 × 471; 18 KB
-
Flat Tax Durchschnittsteuersatz.svg 1,000 × 600; 120 KB
-
Flat Tax Grenzsteuersatz.svg 1,000 × 600; 147 KB
-
Flat Tax Steuerbetrag.svg 1,000 × 600; 123 KB
-
Flussdiagramm Volksinitiative in Mecklenburg-Vorpommern.svg 354 × 530; 8 KB
-
FRA stats.svg 800 × 400; 26 KB
-
Fukushima Dosis new.svg 800 × 560; 38 KB
-
Fukushima Dosis qtl1.svg 750 × 480; 37 KB
-
Fukushima I accidents containment pressures.svg 940 × 600; 197 KB
-
Fukushima I reactor cooling water 2011-07-02.svg 920 × 570; 141 KB
-
Fukushima I reactor cooling water.svg 936 × 546; 136 KB
-
Fukushima I Seawater Contamination Caesium-137.svg 920 × 605; 452 KB
-
Fukushima I Seawater Contamination Iod-131.svg 930 × 610; 475 KB
-
Fukushima I spent fuel pool 4 cooling water March-May 2011.svg 512 × 281; 28 KB
-
Fukushima I Unit 1 accident reactor data.svg 512 × 327; 269 KB
-
Fukushima I Unit 2 accident reactor data.svg 512 × 358; 280 KB
-
Fukushima I Unit 3 RPV Temperature March-May 2011.svg 790 × 485; 485 KB
-
Gartner Hype Cycle-de.svg 559 × 363; 10 KB
-
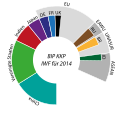
GDP PPP 2013 Selection DE.svg 512 × 509; 22 KB
-
GDP PPP 2014 Selection DE.svg 512 × 512; 55 KB
-
GDP PPP 2016 Selection DE.svg 512 × 512; 94 KB
-
Geldmenge und Inflation im Zarenreich.svg 490 × 270; 16 KB
-
German Cities Pareto Density - de.svg 596 × 438; 29 KB
-
GermanyWind.svg 600 × 400; 18 KB
-
Gini - Koeffizient von Italien und Nachbarländer 2004-2017.svg 512 × 293; 21 KB
-
Gini - Koeffizient von Niederlanden und Nachbarländer 2004-2017.svg 512 × 233; 22 KB
-
Gini at.svg 512 × 284; 12 KB
-
Gini comp hu exact data.svg 512 × 284; 18 KB
-
Gini comparison hu eurostat.svg 512 × 284; 18 KB
-
Gini hu oecd eurostat.svg 512 × 284; 14 KB
-
GINI Irland 2005-2015 OECD.svg 512 × 284; 9 KB
-
GINI OECD FRA 2004-2016 EUROSTAT.svg 512 × 284; 10 KB
-
Gini plot.svg 512 × 293; 9 KB
-
Gini pol 05 17.svg 512 × 293; 23 KB
-
Gini pol 05-17.svg 512 × 293; 23 KB
-
Gini Ungarn 0517.svg 512 × 293; 17 KB
-
Gini Ungarn.svg 512 × 293; 17 KB
-
GINI Vereinigtes Königreich 2003-2015 OECD.svg 512 × 284; 10 KB
-
Gini vergleich österreich.svg 512 × 284; 22 KB
-
Gini- Koeffizient von Italien 2004-2017 vor und nach Steuern.svg 512 × 293; 23 KB
-
Gini-Koeffizient Spanien und EU-27 (2004-2017).svg 512 × 293; 17 KB
-
Gini-Koeffizient Österreich und EU.svg 512 × 293; 16 KB
-
HALBENDORF nieder.svg 512 × 427; 20 KB
-
Heating type CH all cantons 2021 DE.svg 990 × 720; 58 KB
-
Heating type CH Canton AG 2021 DE.svg 1,013 × 720; 12 KB
-
Heating type CH Canton AI 2021 DE.svg 1,013 × 720; 12 KB
-
Heating type CH Canton AR 2021 DE.svg 1,013 × 720; 12 KB
-
Heating type CH Canton BE 2021 DE.svg 1,013 × 720; 12 KB
-
Heating type CH Canton BL 2021 DE.svg 1,013 × 720; 12 KB
-
Heating type CH Canton BS 2021 DE.svg 1,013 × 720; 12 KB
-
Heating type CH Canton FR 2021 DE.svg 1,013 × 720; 12 KB
-
Heating type CH Canton GE 2021 DE.svg 1,013 × 720; 12 KB
-
Heating type CH Canton GL 2021 DE.svg 1,013 × 720; 12 KB
-
Heating type CH Canton GR 2021 DE.svg 1,013 × 720; 12 KB
-
Heating type CH Canton JU 2021 DE.svg 1,013 × 720; 12 KB
-
Heating type CH Canton LU 2021 DE.svg 1,013 × 720; 12 KB
-
Heating type CH Canton NE 2021 DE.svg 1,013 × 720; 12 KB
-
Heating type CH Canton NW 2021 DE.svg 1,013 × 720; 12 KB
-
Heating type CH Canton OW 2021 DE.svg 1,013 × 720; 12 KB
-
Heating type CH Canton SG 2021 DE.svg 1,013 × 720; 12 KB
-
Heating type CH Canton SH 2021 DE.svg 1,013 × 720; 12 KB
-
Heating type CH Canton SO 2021 DE.svg 1,013 × 720; 12 KB
-
Heating type CH Canton SZ 2021 DE.svg 1,013 × 720; 12 KB
-
Heating type CH Canton TG 2021 DE.svg 1,013 × 720; 12 KB
-
Heating type CH Canton TI 2021 DE.svg 1,013 × 720; 12 KB
-
Heating type CH Canton UR 2021 DE.svg 1,013 × 720; 12 KB
-
Heating type CH Canton VD 2021 DE.svg 1,013 × 720; 12 KB
-
Heating type CH Canton VS 2021 DE.svg 1,013 × 720; 12 KB
-
Heating type CH Canton ZG 2021 DE.svg 1,013 × 720; 12 KB
-
Heating type CH Canton ZH 2021 DE.svg 1,013 × 720; 12 KB
-
Herkunft Auslnd Pt.svg 517 × 399; 39 KB
-
HIV-timecourse-de.svg 729 × 433; 179 KB
-
Hoehenprofil zugspitzbahn.svg 990 × 624; 58 KB
-
HOHENFELS KR KONST KALK nieder.svg 512 × 427; 20 KB
-
Hours of Output Rundfunk der DDR.svg 600 × 480; 11 KB
-
Inflationsrate in Sri Lanka 2020-23.svg 512 × 243; 36 KB
-
Intersection of wage and job creation curve.svg 325 × 331; 31 KB
-
IpccAR6WGI-Ch09-seaLevelProjections-2150-de.svg 665 × 262; 41 KB
-
Kausale Abhängigkeit.svg 800 × 342; 19 KB
-
Kondensatoren Kapazität versus Spannungsfestigkeit.svg 1,100 × 700; 36 KB
-
Kopfsteuer Durchschnittsteuersatz.svg 1,000 × 600; 143 KB
-
Kopfsteuer Grenzsteuersatz.svg 1,000 × 600; 147 KB
-
Kopfsteuer Steuerbetrag.svg 1,000 × 600; 122 KB
-
Kurve gleicher lautstärke.svg 1,090 × 569; 139 KB
-
Kwahlenkarlsruhe.svg 654 × 378; 104 KB
-
La Famiglia Cuntrera.svg 1,200 × 660; 131 KB
-
Landnutzung2009.svg 910 × 556; 34 KB
-
Lebenserwartung Deutschland-Welt 1960-2009.svg 540 × 360; 100 KB
-
Lebenserwartung in ausgewählten afrikanischen Ländern südlichen.svg 1,429 × 996; 130 KB
-
LeitzinsenDE.svg 1,260 × 900; 84 KB
-
Life expectancy in select Southern African countries 1960-2012 de.svg 1,346 × 865; 23 KB
-
Ligaplaetze Arminia Bielefelds seit 1963.svg 1,036 × 738; 116 KB
-
Lorenzkurve.svg 614 × 608; 39 KB
-
LoxodromeOrthodrome.svg 700 × 550; 3 KB
-
MA Kindersender 3-13 Jahre ab 2005.svg 1,138 × 616; 63 KB
-
MA Kindersender ab 3 Jahren.svg 1,138 × 616; 67 KB
-
Marktanteil Kabel eins.svg 1,052 × 616; 37 KB
-
Marktanteil ProSieben.svg 672 × 606; 153 KB
-
Marktanteil RTL2.svg 1,119 × 620; 58 KB
-
Marktanteil sixx.svg 1,052 × 616; 30 KB
-
Marktanteil VOX.svg 1,119 × 620; 50 KB
-
Marktanteil-sat1.svg 1,052 × 616; 44 KB
-
Material-intensity-world-europe.svg 575 × 431; 35 KB
-
Mauna Loa CO2 monthly mean concentration DE.svg 755 × 755; 444 KB
-
Meatproduction in Germany.svg 402 × 243; 53 KB
-
Memristor German.svg 444 × 341; 18 KB
-
Methanol-use-txt.svg 1,200 × 400; 22 KB
-
Mindmap mit Inhalten der Kryptologie.svg 1,200 × 816; 206 KB
-
Modellvergleich 20 30.0 0.114 0.842.svg 720 × 1,080; 106 KB
-
MSCI World Historie 1969 - 2020.svg 1,687 × 1,155; 81 KB
-
Muskelreiz-skelett.svg 209 × 169; 25 KB
-
Near-stars-past-future-de.svg 999 × 800; 44 KB
-
OECD Gini - Koeffizient Italien vor und nach Steuern 2004-2016.svg 512 × 233; 12 KB


