Category:Geographic maps of human mtDNA haplogroup frequencies
Jump to navigation
Jump to search
English: This category is for the contour map style images which showing human mtDNA haplogroup frequencies. For the bar chart or pie chart style images, see Category:Human mtDNA haplogroup frequency charts.
Media in category "Geographic maps of human mtDNA haplogroup frequencies"
The following 94 files are in this category, out of 94 total.
-

-
 Contour (surface) maps of mtDNA L1b sub-haplogroup.png 2,066 × 2,223; 179 KB
-
 Contour (surface) maps of mtDNA L2a sub-haplogroup.png 1,110 × 1,577; 118 KB
-
 Contour (surface) maps of mtDNA L2b sub-haplogroup.png 1,126 × 1,586; 123 KB
-
 Contour (surface) maps of mtDNA L3b sub-haplogroup.png 1,122 × 1,574; 132 KB
-
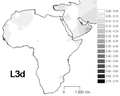
 Contour (surface) maps of mtDNA L3d sub-haplogroup.png 1,129 × 1,591; 114 KB
-
 Contour (surface) maps of mtDNA L3f sub-haplogroup.png 1,112 × 1,598; 124 KB
-
 Contour (surface) maps of mtDNA L3h1b sub-haplogroup.png 1,126 × 1,586; 103 KB
-
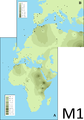 Contour (surface) maps of mtDNA M1 haplogroup.png 1,111 × 1,591; 120 KB
-
 Contour (surface) maps of mtDNA U6 haplogroup.png 1,108 × 1,607; 110 KB
-
 Contour (surface) maps of mtDNA U6a sub-haplogroup.png 2,067 × 2,203; 171 KB
-
 East Eurasian admixture in Europe.png 800 × 581; 67 KB
-
 Eurasian frequency distribution of mtDNA haplogroup Z.png 932 × 283; 106 KB
-
 Eurasian frequency distributions of mtDNA haplogroups C.png 935 × 294; 149 KB
-
 Frequency distribution maps for mtDNA haplogroup B4b1.png 509 × 364; 130 KB
-
 Frequency distribution maps for mtDNA haplogroup B4c1.png 515 × 369; 131 KB
-
 Frequency distribution maps for mtDNA haplogroup B5b.png 521 × 368; 150 KB
-
 Frequency distribution maps for mtDNA haplogroup F1a4.png 516 × 362; 94 KB
-
 Frequency distribution maps for mtDNA haplogroup F3.png 513 × 365; 115 KB
-
 Frequency distribution maps for mtDNA haplogroup L2.jpg 926 × 626; 66 KB
-
 Frequency distribution maps for mtDNA haplogroup N9a.png 516 × 362; 151 KB
-
 Frequency distribution maps for mtDNA haplogroup R9b.png 511 × 361; 118 KB
-
 Frequency distribution maps for mtDNA haplogroup R9c.png 518 × 366; 137 KB
-
 Frequency distribution maps for mtDNA haplogroup Y2.png 515 × 366; 128 KB
-
 Frequency distribution maps for mtDNA haplogroups K.png 645 × 472; 266 KB
-
 Frequency distribution maps for mtDNA haplogroups U8a1a.png 651 × 471; 249 KB
-
 Frequency distribution maps for mtDNA haplogroups U8b1.png 651 × 471; 277 KB
-
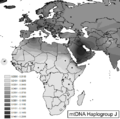 Frequency maps based on HVS-I data for haplogroups J.png 516 × 511; 37 KB
-
 Frequency maps based on HVS-I data for haplogroups L0 (total).png 862 × 738; 88 KB
-
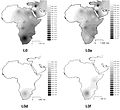
 Frequency maps based on HVS-I data for haplogroups L0, L0a, L0b, L0d, L0f and L0k.png 1,775 × 2,268; 634 KB
-
 Frequency maps based on HVS-I data for haplogroups L0a.png 887 × 732; 1.86 MB
-
 Frequency maps based on HVS-I data for haplogroups L0b.png 883 × 738; 1.87 MB
-
 Frequency maps based on HVS-I data for haplogroups L0d.png 875 × 742; 1.86 MB
-
 Frequency maps based on HVS-I data for haplogroups L0f.png 867 × 741; 1.84 MB
-
 Frequency maps based on HVS-I data for haplogroups L0k.png 882 × 738; 1.87 MB
-
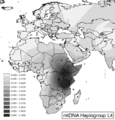 Frequency maps based on HVS-I data for haplogroups L4.png 505 × 529; 64 KB
-
 Frequency maps based on HVS-I data for haplogroups L6.png 516 × 529; 63 KB
-
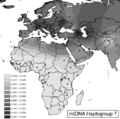 Frequency maps based on HVS-I data for haplogroups T.png 517 × 511; 36 KB
-
 Frequency maps for mtDNA haplogroup U6 and several sub-groups.jpg 1,200 × 1,692; 391 KB
-
 Geographic maps of the mtDNA haplogroup frequencies in Iberian Peninsula.PNG 3,107 × 4,500; 4.82 MB
-
 Haplo-mt-Europa.png 2,902 × 2,354; 7.71 MB
-
 Haplogroup J2.png 1,200 × 649; 449 KB
-
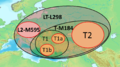
 Haplogroup LT (L298-P326).png 852 × 656; 146 KB
-
 Haplogroup X (mtDNA).PNG 835 × 426; 28 KB
-
 Haplogroup-T in Europe.png 800 × 581; 74 KB
-
 Interpolation frequency map of mtDNA U6 across Mediterranean basin.jpg 1,200 × 659; 84 KB
-
 Interpolation maps for haplogroup L1b and L1c.png 774 × 300; 109 KB
-
 Interpolation maps for L0 haplogroup total.png 386 × 316; 63 KB
-
 Interpolation maps for L0 haplogroup.jpg 811 × 741; 87 KB
-
 Interpolation maps for L1 haplogroup total.png 377 × 309; 64 KB
-
 Interpolation maps for L1 haplogroup.jpg 811 × 739; 68 KB
-
 Interpolation maps for L1b haplogroup.png 386 × 312; 354 KB
-
 Interpolation maps for L1c haplogroup.png 389 × 310; 354 KB
-
 Interpolation maps for L2 haplogroup total.png 383 × 295; 67 KB
-
 Interpolation maps for L2 haplogroup.jpg 810 × 1,078; 109 KB
-
 Interpolation maps for L2a haplogroup.png 391 × 291; 334 KB
-
 Interpolation maps for L2b haplogroup.png 388 × 305; 348 KB
-
 Interpolation maps for L2c haplogroup.png 386 × 306; 347 KB
-
 Interpolation maps for L2d haplogroup.png 392 × 298; 343 KB
-
 Interpolation maps for L3 total haplogroups.png 388 × 310; 70 KB
-
 Interpolation maps for L3b haplogroup.png 382 × 308; 346 KB
-
 Interpolation maps for L3b, L3d, L3e, L3f L3h, L3i, L3x and L3w haplogroups.png 834 × 1,450; 450 KB
-
 Interpolation maps for L3d haplogroup.png 383 × 306; 344 KB
-
 Interpolation maps for L3e haplogroup.png 386 × 306; 347 KB
-
 Interpolation maps for L3f haplogroup.png 390 × 310; 355 KB
-
 Interpolation maps for L3i haplogroup.png 396 × 306; 356 KB
-
 Interpolation maps for L3x haplogroup.png 390 × 299; 343 KB
-
 LT-L298 Place of origin.png 1,291 × 724; 1.38 MB
-
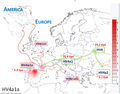 Map of Europe showing the frequency distribution of mtDNA haplogroup HV4a1a.png 2,595 × 2,030; 940 KB
-
 Migraciones humanas en haplogrupos mitocondriales.PNG 1,433 × 736; 135 KB
-
 Migration route of Human mtDNA haplogroups.png 1,458 × 794; 273 KB
-

-

-

-

-
 Mt-Haplogruppen-Wanderung.png 1,439 × 742; 175 KB
-
 MtDNA haplogroup B4a and B4a1a1 in Island Southeast Asia and the western Pacific.png 2,325 × 2,671; 3.34 MB
-
 MtDNA haplogroup tree and distribution map.gif 2,820 × 1,365; 380 KB
-
 Phylogeny and distribution of mtDNA haplogroup C1b.jpg 926 × 900; 123 KB
-
 Spatial frequency distribution (%) of haplogroup H1 in western Eurasia and North Africa..png 2,872 × 2,154; 2.15 MB
-
 Spatial frequency distribution maps of mtDNA haplogroup R0a.png 658 × 582; 371 KB
-
-
 Spatial frequency distribution of different sub-lineages of mtDNA haplogroup H.png 1,822 × 2,789; 1.4 MB
-
 Spatial frequency distribution of haplogroup W.png 2,106 × 950; 643 KB
-

-
-
 Spatial frequency distribution of mtDNA haplogroup H2a.png 836 × 528; 1.27 MB
-
 Spatial frequency distribution of mtDNA haplogroup M12.png 635 × 597; 195 KB
-
 Spatial frequency distribution of mtDNA haplogroups I.png 2,102 × 955; 632 KB
-
 Spatial frequency distributions of haplogroup M9a'b and its sub-haplogroups.jpg 1,200 × 1,599; 311 KB
-
 Spatial frequency distributions of haplogroup M9a'b.png 587 × 383; 221 KB
-
 Surfer maps and networks of haplogroups L3d and L3f.png 2,000 × 2,612; 864 KB
-
 The frequency distribution of R7a and R7b clades in Indian subcontinent.jpg 1,200 × 950; 166 KB
-
 Y haplo H.png 668 × 452; 36 KB

_maps_of_mtDNA_L1b_sub-haplogroup.png)
_maps_of_mtDNA_L2a_sub-haplogroup.png)
_maps_of_mtDNA_L2b_sub-haplogroup.png)
_maps_of_mtDNA_L3b_sub-haplogroup.png)
_maps_of_mtDNA_L3d_sub-haplogroup.png)
_maps_of_mtDNA_L3f_sub-haplogroup.png)
_maps_of_mtDNA_L3h1b_sub-haplogroup.png)
_maps_of_mtDNA_M1_haplogroup.png)
_maps_of_mtDNA_U6_haplogroup.png)
_maps_of_mtDNA_U6a_sub-haplogroup.png)


.png)


.png)
.PNG)


_of_haplogroup_H1_in_western_Eurasia_and_North_Africa..png)


