Category:Geochemical diagrams
Jump to navigation
Jump to search
Subcategories
This category has the following 5 subcategories, out of 5 total.
Media in category "Geochemical diagrams"
The following 171 files are in this category, out of 171 total.
-
Abietane Diagenesis Scheme.svg 512 × 384; 2.4 MB
-
Abietic Acid Diagenesis horizontal.svg 809 × 423; 38 KB
-
AFM diagram -.svg 764 × 660; 36 KB
-
AFM diagram.png 2,000 × 1,728; 64 KB
-
AFM diagram.svg 764 × 660; 63 KB
-
Aluminum Cycle Flow 2.png 856 × 525; 73 KB
-
AMD conceptual model.jpg 1,013 × 568; 697 KB
-
Arsenic cycle with title.png 1,437 × 1,150; 199 KB
-
As biogeochemical cycle.png 1,368 × 815; 98 KB
-
ATM Oxygen Content fi.svg 744 × 524; 40 KB
-
Atmospheric oxygen over time.png 1,020 × 569; 36 KB
-
Basalti2.svg 717 × 674; 125 KB
-
Biogeochem.svg 425 × 378; 50 KB
-
BIOGEOCHEMICAL SELECTIVENESS Fig1.jpg 490 × 639; 49 KB
-
Biomineralization.jpg 1,118 × 718; 900 KB
-
Black Smoker Chem.svg 744 × 1,052; 180 KB
-
Boron Cycle.jpg 14,400 × 9,600; 7.24 MB
-
Boron cycle.png 3,456 × 2,304; 1.13 MB
-
Bromine Biogeochemical Cycle .pdf 1,275 × 1,650; 183 KB
-
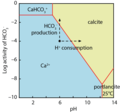
Calcium speciation.png 900 × 842; 40 KB
-
Carbon cycle-cute diagram pt.svg 540 × 417; 135 KB
-
Carbon cycle.png 925 × 821; 56 KB
-
Carbone flux2.png 1,157 × 1,400; 89 KB
-
Carbone flux2.svg 1,157 × 1,400; 25 KB
-
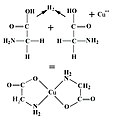
Chelazione di uno ione cuprico.jpg 533 × 555; 34 KB
-
Chemical and physical change after reclamation.png 624 × 1,011; 106 KB
-
Chemical evolution.png 940 × 460; 105 KB
-
Chemical laterite profile 003.jpg 1,536 × 2,048; 609 KB
-
Chemical laterite profile 005.jpg 1,536 × 2,048; 596 KB
-
Chemical reaction at coast.png 1,130 × 611; 158 KB
-
Chromium Cycle.jpg 2,560 × 1,500; 642 KB
-
Chromium Geochemical Cycle .png 4,664 × 2,638; 419 KB
-
Ciclo dellAzoto.jpg 475 × 370; 41 KB
-
CO2 pump hg as.svg 720 × 505; 46 KB
-
CO2 pump hg-bn.svg 720 × 505; 47 KB
-
CO2 pump hg-fr.svg 720 × 505; 46 KB
-
CO2 pump hg-hi.svg 720 × 505; 48 KB
-
CO2 pump hg-ru.svg 679 × 475; 8 KB
-
CO2 pump hg-te.svg 720 × 505; 47 KB
-
CO2 pump hg.svg 720 × 505; 46 KB
-
CO2 pump hg.svg-mr.svg 720 × 505; 47 KB
-
Concentration profile of sulfate and methane.svg 800 × 600; 44 KB
-
ConcordiaDiagram.jpg 990 × 720; 58 KB
-
Cornubian Batholith Granites 2.jpg 2,213 × 876; 434 KB
-
Correlation Thomas.png 771 × 704; 7 KB
-
Curva-isotopica.jpg 501 × 285; 31 KB
-
Cycle du carbone.png 1,024 × 768; 155 KB
-
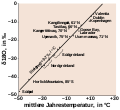
Dansgaard delta-O-18 Temperature-de.svg 371 × 340; 38 KB
-
Deep Sea Vent Chemistry Diagram workaround.svg 2,198 × 1,266; 149 KB
-
Deep sea vent chemistry diagram.jpg 2,199 × 1,278; 1.17 MB
-
Deep Sea Vent Chemistry Diagram.svg 2,198 × 1,266; 20 KB
-
Delta-O-18 en sedimentos aguas profundas.svg 746 × 468; 51 KB
-
Delta-O-18 en sediments d'aigües profundes.svg 746 × 468; 51 KB
-
Delta-O-18 in deep sea sediment-svg.svg 746 × 468; 51 KB
-
Delta-O-18 in deep sea sediment.png 385 × 216; 5 KB
-
DIC speciation.png 774 × 609; 34 KB
-
Dinolrg.png 614 × 442; 65 KB
-
Diplopterol-LakeAlbano.png 1,127 × 1,627; 194 KB
-
DMM.png 1,019 × 529; 30 KB
-
Draft of the Silica cycle.jpg 1,280 × 720; 109 KB
-
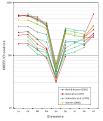
Effetto della normalizzazione sui pattern delle concentrazioni delle REE.jpg 2,515 × 2,473; 320 KB
-
Element abundance earth ppm chart.svg 512 × 512; 62 KB
-
Elemental abundances-RUS.svg 2,993 × 2,192; 14 KB
-
Energy yield of iron reduction.png 1,400 × 559; 26 KB
-
Environmental and geochemical changes of the CPE.jpg 1,050 × 1,240; 274 KB
-
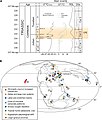
Evolution of groundwater chemistry.jpg 1,706 × 990; 1.11 MB
-
Example of CO2 H2S multi-GAS data.png 739 × 460; 27 KB
-
ExchangeESP.JPG 609 × 320; 18 KB
-
Fates of soil CO2.png 1,043 × 829; 152 KB
-
Forms of carbon in deep Earth.jpg 2,000 × 1,388; 522 KB
-
Geochem.jpg 354 × 387; 99 KB
-
Geochem.svg 425 × 378; 44 KB
-
Geochemical Spider Diagrams.jpg 1,585 × 2,154; 364 KB
-
GH estability.jpg 416 × 449; 42 KB
-
Gibbs free energy changes.png 1,308 × 590; 32 KB
-
Global meteoric water line.tif 3,216 × 2,461; 77 KB
-
GOHANAFREQ.jpg 623 × 441; 29 KB
-
Greenhouse gas trends.jpg 1,860 × 455; 178 KB
-
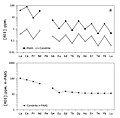
Greenhouse gases seasonal cycles.jpg 762 × 803; 188 KB
-
Grip-ngrip-do18-closeup.png 1,250 × 875; 80 KB
-
Half-logarithm graph.jpg 1,183 × 829; 311 KB
-
Heinrich-events.png 1,250 × 875; 170 KB
-
Helium concentration 2.jpg 827 × 443; 93 KB
-
Helium concentration.jpg 880 × 523; 97 KB
-
Helium concentrations.jpg 1,733 × 525; 187 KB
-
Helium survey 1.jpg 3,173 × 925; 361 KB
-
Helium survey 2.jpg 3,165 × 929; 365 KB
-
Helium survey 3.jpg 3,161 × 941; 388 KB
-
Helium survey 4.jpg 3,153 × 941; 376 KB
-
Hem comp of ccv tuffs.jpg 671 × 395; 40 KB
-
Hydrothermal system.png 1,804 × 1,076; 140 KB
-
Hydrothermal vent chemistry.gif 664 × 424; 103 KB
-
Hydrothermalquelle der Tiefsee.png 2,161 × 1,237; 1.48 MB
-
Interlingua cyclosbiogenic.JPG 496 × 146; 18 KB
-
Iron cycle.svg 512 × 384; 98 KB
-
Iron cycle7.png 4,032 × 3,024; 1.25 MB
-
-
-
JacksonAggTheory.JPG 343 × 82; 5 KB
-
KREEP.svg 535 × 623; 157 KB
-
Lead Cycle Updated.jpg 6,035 × 3,303; 907 KB
-
Lead Cycle.jpg 6,035 × 3,303; 857 KB
-
Lithium Cycle Diagram.png 1,016 × 607; 80 KB
-
Local meteoric water line.tif 3,216 × 2,461; 77 KB
-
Marine sediment.jpg 1,585 × 1,173; 888 KB
-
Mauna Loa Carbon Dioxide-de.svg 850 × 547; 19 KB
-
Microbial iron cycle.png 635 × 931; 48 KB
-
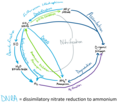
Microbial nitrogen cycle.png 874 × 760; 46 KB
-
Microbial sulfur cycle.png 843 × 887; 59 KB
-
Mikrobiologiczna pętla.JPG 721 × 541; 45 KB
-
Mineral-water interface processes.jpg 1,558 × 1,480; 318 KB
-
Mittelozeanischer Ruecken - Schema.png 1,405 × 480; 53 KB
-
Molecular structures and HPLC detection of GDGTs.jpg 926 × 469; 47 KB
-
Na-Cl.jpg 1,878 × 1,878; 2.5 MB
-
Natural sulfur isotope range.png 2,363 × 1,500; 209 KB
-
Ngrip-epica-do18.png 981 × 567; 11 KB
-
Nitrogen cycle for Hydrothermal Vents.png 2,138 × 1,718; 375 KB
-
Nitrogen cycle of hydrothermal vents 2.png 1,896 × 1,636; 366 KB
-
Nitrous oxide sources.jpg 1,552 × 744; 1.05 MB
-
Okenone and Okenane.png 1,542 × 527; 54 KB
-
Okenone Reductive Desulphurization to Okenane.png 1,501 × 1,077; 117 KB
-
Oxygen Buffers.jpg 600 × 478; 105 KB
-
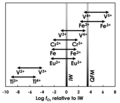
Oxygen fugacity range where cation pairs dominate.png 1,450 × 1,244; 131 KB
-
OxygenLevel-1000ma.svg 2,525 × 1,727; 2 KB
-
Paradoxo11.jpg 1,207 × 1,401; 401 KB
-
Pfunze belt concordia.png 1,298 × 869; 57 KB
-
Phanerozoic Carbon Dioxide.png 586 × 409; 62 KB
-
Phase diagram of water under martian conditions.svg 512 × 423; 61 KB
-
Phase-diag vi.png 574 × 480; 36 KB
-
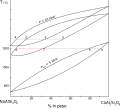
Phase-diag2.svg 530 × 443; 23 KB
-
Phasendiagramm-sio2-al2o3.svg 440 × 310; 63 KB
-
Porcentaje en peso corteza terrestre.png 458 × 348; 41 KB
-
Portland and Geopolymer.jpg 309 × 252; 28 KB
-
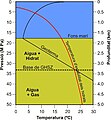
Pressione temperatura.svg 541 × 392; 103 KB
-
Pressione.svg 722 × 651; 90 KB
-
Produzione uranio-it.svg 802 × 912; 62 KB
-
PSM V29 D378 Ether and olefiant gas curves charted.png 1,026 × 510; 38 KB
-
Purple and Green Sulfur Bacteria and Their Biomarkers.png 1,967 × 738; 165 KB
-
Reazioni.svg 718 × 552; 231 KB
-
Redox framework.png 1,898 × 1,113; 85 KB
-
Redox reaction.png 391 × 168; 5 KB
-
Redox zonation.png 998 × 846; 65 KB
-
Reservoirs and fluxes of carbon in deep Earth.png 2,000 × 1,304; 229 KB
-
Sauerstoffgehalt-1000mj.svg 720 × 529; 54 KB
-
Sauerstoffgehalt-1000mj2-ru.svg 2,525 × 1,727; 2 KB
-
Sauerstoffgehalt-1000mj2.png 2,000 × 1,409; 74 KB
-
Seleniumcycle.gif 391 × 467; 8 KB
-
Silica speciation.png 893 × 852; 35 KB
-
Sm Nd Great Dyke Isochron.png 832 × 739; 32 KB
-
Solid det.JPG 578 × 412; 14 KB
-
SRM methanogen model results.png 1,417 × 1,014; 100 KB
-
Superheavy decay modes predicted.png 970 × 640; 164 KB
-
Température et CO2.svg 1,052 × 744; 39 KB
-
Toms-sulfur-from-volcanos-1979-2003.gif 1,045 × 755; 27 KB
-
Two models.jpg 611 × 321; 39 KB
-
Uranionaren ekoizpena-eu.svg 802 × 912; 62 KB
-
Uranium distribution in crust.PNG 678 × 869; 33 KB
-
Vcycle.jpg 1,280 × 720; 95 KB
-
Weathering.jpg 1,580 × 1,002; 936 KB
-
Гелиевая съемка мониторинг.jpg 853 × 543; 91 KB
-
Концентрации гелия.jpg 851 × 540; 127 KB
-
Мінеральний склад земної кори (%).png 713 × 382; 191 KB
-
Площадная гелиевая съемка.jpg 853 × 537; 88 KB
-
ขั้นตอนวิเคราะห์ไบโอมาร์คเกอร์.jpg 605 × 449; 44 KB


