Category:Genetic studies on sub-Saharan African populations
Jump to navigation
Jump to search
English: Genetic studies on peoples of sub-Saharan Africa.
日本語: サハラ以南のアフリカの人々に関する遺伝的研究
Subcategories
This category has the following 35 subcategories, out of 35 total.
A
- Genetic studies on Alur (1 F)
B
- Genetic studies on Biaka (10 F)
- Bantu expansion (5 F)
C
E
F
G
H
- Genetic studies on Hausa (7 F)
I
- Genetic studies on Igbo (4 F)
L
- Genetic studies on Luhya (16 F)
M
- Genetic studies on Maasai (18 F)
- Genetic studies on Mbuti (10 F)
N
P
S
- Genetic studies on San (15 F)
U
Y
Media in category "Genetic studies on sub-Saharan African populations"
The following 43 files are in this category, out of 43 total.
-
ADMIXTURE analysis of Horn of Africa populations in a broad context.png 4,041 × 3,002; 3.71 MB
-
ADMIXTURE plots of sub-Saharan African populations.png 4,211 × 1,817; 3.12 MB
-
Africa ethnic groups 1996.jpg 2,446 × 2,819; 4.98 MB
-
Africa ethnic groups 1996.png 8,651 × 10,315; 154.88 MB
-
Box-and-whisker plot of human heterozygosity.png 1,273 × 1,278; 304 KB
-
Distribution of haplogroup e1b1a in Rosa 2007.jpg 600 × 477; 67 KB
-
Frappe analysis of the sub-Saharan African groups.png 659 × 497; 41 KB
-
Fst and TVD of sub-Saharan Africans.jpg 3,536 × 2,920; 1.83 MB
-
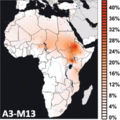
Geographical frequency distribution of Haplogroup A3-M13 (Y-DNA).png 1,145 × 1,148; 1.2 MB
-
Geographical frequency distribution of Haplogroup A3-V2336 (Y-DNA).png 1,148 × 1,149; 1.06 MB
-
Geographical frequency distribution of Haplogroup A3-V3663 (Y-DNA).png 1,142 × 1,142; 1.1 MB
-
Geographical frequency distribution of Haplogroup A3-V5912 (Y-DNA).png 1,161 × 1,148; 1.11 MB
-
Geographical frequency distribution of Haplogroup E-M191 (Y-DNA).png 1,139 × 1,140; 1.05 MB
-
Geographical frequency distribution of Haplogroup E-M2 (Y-DNA).png 1,166 × 1,137; 1.19 MB
-
Geographical frequency distribution of Haplogroup E-M78 (Y-DNA).png 1,139 × 1,145; 1.08 MB
-
Geographical frequency distribution of Haplogroup E-U209 (Y-DNA).png 1,139 × 1,139; 1.1 MB
-
Geographical frequency distribution of Haplogroup E-V12 (Y-DNA).png 1,149 × 1,144; 1.01 MB
-
Geographical frequency distribution of Haplogroup E-V22 (Y-DNA).png 1,136 × 1,145; 1,014 KB
-
Geographical frequency distribution of Haplogroup E-V264 (Y-DNA).png 1,136 × 1,145; 1,008 KB
-
Geographical frequency distribution of Haplogroup E-Z15939 (Y-DNA).png 1,140 × 1,139; 1.05 MB
-
Geographical frequency distribution of Haplogroup R-V1589 (Y-DNA).png 1,136 × 1,145; 1.04 MB
-
Geographical frequency distribution of Haplogroup R-V4759 (Y-DNA).png 1,135 × 1,145; 1,015 KB
-
Geographical frequency distribution of Haplogroup R-V69 (Y-DNA).png 1,135 × 1,140; 982 KB
-
Geographical frequency distribution of Haplogroup R-V88 (Y-DNA).png 1,136 × 1,145; 1.1 MB
-
Haplotype analysis of sickle-cell trait.png 1,181 × 837; 322 KB
-
Hierarchical population tree of sub-Saharan African populations.png 1,775 × 887; 750 KB
-
Malaria versus sickle-cell trait distributions.png 1,346 × 726; 224 KB
-
MrDNA Haplogroup composition of sub-Saharan African regions.png 844 × 745; 418 KB
-
MtDNA Haplogroup composition of sub-Saharan African countries - L5.png 926 × 863; 459 KB
-
MtDNA Haplogroup composition of sub-Saharan African countries.jpg 926 × 863; 152 KB
-
Niger-Congo map with delimitation.png 1,207 × 1,139; 347 KB
-
Niger-Congo map.png 1,207 × 1,139; 132 KB
-
PCA of sub-Saharan Africa populations.png 2,683 × 1,255; 1.59 MB
-
PCA of sub-Saharan African populations.png 1,832 × 1,730; 1.37 MB
-
PCA result of the sub-Saharan African groups.png 642 × 471; 17 KB
-
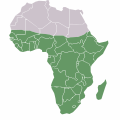
Sub-Saharan Africa with borders.svg 341 × 341; 65 KB
-
Worldwide human populations - frappe results.png 2,061 × 1,390; 815 KB
-
Worldwide human populations - PCA results.png 2,067 × 1,206; 429 KB


