Category:Genetic studies on Tibetans
Jump to navigation
Jump to search
English: Genetic studies on Tibetans, people living in Tibet in Central Asia and East Asia, speaking Tibetic languages.
Media in category "Genetic studies on Tibetans"
The following 33 files are in this category, out of 33 total.
-
Admixture analysis of East Asian populations.png 1,195 × 888; 211 KB
-
Admixture analysis of Nepalese and Sherpa.png 1,828 × 880; 261 KB
-
Ethnolinguistic map of China 1983.jpg 1,024 × 960; 122 KB
-
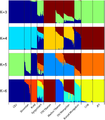
Genetic relationships between population pairs of Tibetan and others - frappe.png 4,687 × 1,238; 345 KB
-
Genetic relationships between population pairs of Tibetan and others - PCA.png 3,238 × 2,665; 394 KB
-
Genetic relationships between population pairs of Tibetan and others.png 3,439 × 4,597; 711 KB
-
Genome-wide admixture of Eurasian individuals inferred by ADMIXTURE.png 1,906 × 2,171; 100 KB
-
Geographic distribution of Y chromosome haplogroup D1.png 2,527 × 1,788; 1.09 MB
-
Geographic distribution of Y chromosome haplogroup D3a.png 2,496 × 1,778; 1.12 MB
-
Geographic distributions of Y chromosome haplogroups D-M174 in East Asia.png 1,434 × 1,351; 984 KB
-
Locations and genetic makeup of the Malays and other populations.jpg 926 × 677; 120 KB
-
MtDNA haplogroup distribution of Tibetans with different geographic locations.jpg 2,000 × 1,556; 261 KB
-
Neighbor-joining tree of Northern Eurasian populations.png 1,917 × 2,371; 136 KB
-
PCA of Nepalese and neighbouring populations.png 1,100 × 913; 419 KB
-
PCA of ten northern Eurasian populations and six East Asian populations.png 1,956 × 3,186; 496 KB
-
PCA study of East Asian populations.png 665 × 909; 251 KB
-
Phylogenetic tree and PCA of East Asian populations.png 553 × 828; 127 KB
-
Plots of pairwise Fst of Tibetan in Gannan, Tianzhu and other 59 worldwide populations.png 2,258 × 2,002; 1.44 MB
-
Principal component analysis among Asian populations.jpg 1,280 × 1,217; 72 KB
-
Procrustes-transformed PCA plot of genetic variation of Asian populations.png 2,069 × 1,390; 404 KB
-
Run of homozygosity in Himalayan populations.png 676 × 515; 6 KB
-
Run of homozygosity in Sherpa and Nepalese populations.png 1,529 × 894; 213 KB
-
Spatial frequency distributions of haplogroup M9a'b.png 587 × 383; 221 KB
-
The Y-STR network of four minor haplogroups in Sherpas.png 729 × 736; 196 KB
-
Tibet claims.svg 1,070 × 695; 975 KB
-
Y chromosome and mtDNA haplogroup frequencies of studied Qiangic populations.png 4,981 × 2,394; 8.52 MB


