Category:Genetic studies on Italians
Jump to navigation
Jump to search
aspect of history | |||||
| Upload media | |||||
| Instance of | |||||
|---|---|---|---|---|---|
| Location |
| ||||
| |||||
Subcategories
This category has the following 4 subcategories, out of 4 total.
Media in category "Genetic studies on Italians"
The following 63 files are in this category, out of 63 total.
-
45332601nd7 (1).jpg 815 × 972; 276 KB
-
ADMIXTURE analysis of Horn of Africa populations in a broad context.png 4,041 × 3,002; 3.71 MB
-
ADMIXTURE analysis of Italians.png 2,522 × 609; 185 KB
-
ADMIXTURE results of Arabian and other populations.png 2,050 × 1,073; 342 KB
-
ADMIXUTRE plot of 758 individuals from 55 populations.png 1,200 × 792; 895 KB
-
Analysis of AIMs in Italian populations versus other continental population groups.png 2,911 × 1,525; 1.02 MB
-
Ancestral components of the Balto-Slavic gene pool.PNG 2,247 × 1,461; 833 KB
-
Anthropological maps of Italy.png 2,356 × 1,600; 2.59 MB
-
Barrier analysis of European gene pool.png 884 × 607; 98 KB
-
BiasuttiMappa.gif 1,197 × 1,430; 103 KB
-
BiasuttiMappa.png 1,197 × 1,430; 1.45 MB
-
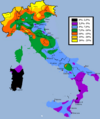
Blond hair Italy.png 1,197 × 1,430; 97 KB
-
Brown hair Italy in 1863.png 1,082 × 1,312; 805 KB
-
Collage of Italian sportswomen.jpg 1,200 × 1,500; 333 KB
-
Europe location ITA.png 1,600 × 1,200; 712 KB
-
European Ancestry Specific PCA of South American populations.PNG 2,182 × 796; 373 KB
-
European genetic structure (based on SNPs) PC analysis.png 2,067 × 1,552; 1.12 MB
-
European population substructure.png 1,792 × 1,280; 981 KB
-
Famous Italians Mosaic.png 1,250 × 1,500; 3.06 MB
-
Figure 2a (Cropped) PCA of Europeans.jpg 337 × 356; 19 KB
-
Genetic PCA of European countries 2022.jpg 4,189 × 3,184; 4.15 MB
-
Gentic Map of Europe.png 781 × 544; 181 KB
-
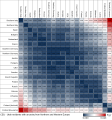
Heat map of pair-wise Fst between European populations.svg 985 × 1,051; 601 KB
-
Heatmap plot of FST distances among Northeast Eurasian populations.jpg 1,200 × 1,307; 251 KB
-
Isofrequency map of Y-DNA haplogroup R-S28 in West-Europe.png 753 × 486; 289 KB
-
Italy (orthographic projection).svg 792 × 792; 1.79 MB
-
Jewish communities in Italy.jpg 1,000 × 1,217; 179 KB
-
Livi Capelli Rossi.jpg 673 × 913; 202 KB
-
MDS analysis of European, Jewish, and Middle Eastern populations.png 1,357 × 786; 315 KB
-
MtDNA and Y-chromosome haplogroup frequencies in Italy.png 2,541 × 1,976; 1.18 MB
-
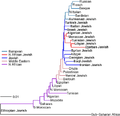
Neighbor-joining tree of Jewish people and others.png 520 × 504; 64 KB
-
Notable Italian Americans.png 400 × 720; 613 KB
-
PCA analysis of several European populations.jpg 685 × 712; 62 KB
-
PCA of 2305 Estonian samples.webp 1,804 × 735; 112 KB
-
PCA of Italians and European and Mediterranean populations.png 2,008 × 3,937; 1.09 MB
-
PCA of Mediterranean Bronze and Iron Age Populations.jpg 1,280 × 747; 85 KB
-
PCA plot of European individuals.png 853 × 595; 63 KB
-
PCA results of Arabian and other populations.png 1,352 × 1,223; 329 KB
-
Plos.Balkans.2-ar.png 4,000 × 1,568; 855 KB
-
Plos.Balkans.2.png 4,033 × 1,581; 415 KB
-
Population structure for European, Jewish, and Middle Eastern populations.jpg 1,200 × 1,697; 499 KB
-
Population structure of centenarians and controls.png 2,773 × 1,838; 1.52 MB
-
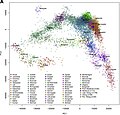
Principal Component Analysis of the Italian population.png 897 × 897; 198 KB
-
Procrustes-transformed PCA plot of genetic variation of European populations.png 2,011 × 935; 440 KB
-
Provaafrica.jpg 216 × 218; 34 KB
-
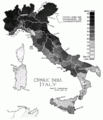
PSM V51 D742 Cephalic index of italy.png 2,227 × 2,589; 489 KB
-
PSM V51 D745 Relative frequency of brunet traits.png 2,247 × 2,563; 465 KB
-
ROH of European populations.png 973 × 611; 107 KB
-
SNP-Based PC of 1,262 individuals from 10 sub-populations.png 1,850 × 813; 206 KB
-
Sub-continental origin of European haplotypes derived from admixed genomes.png 4,086 × 3,001; 2.54 MB
-
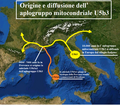
U5b3 haplogroup.png 880 × 770; 1.38 MB
-
World Factbook (1982) Italy.jpg 589 × 586; 97 KB
-
Y-Haplogroup R1 distribution.png 600 × 333; 130 KB


