Category:Genetic studies on Finns
Jump to navigation
Jump to search
Subcategories
This category has only the following subcategory.
S
Media in category "Genetic studies on Finns"
The following 41 files are in this category, out of 41 total.
-
3D PCA of SWE and FIN.gif 1,700 × 600; 6.37 MB
-
ADMIXTURE analysis of Italians.png 2,522 × 609; 185 KB
-
Ancestral components of the Balto-Slavic gene pool.PNG 2,247 × 1,461; 833 KB
-
Barrier analysis of European gene pool.png 884 × 607; 98 KB
-
Census-2000-Data-Top-US-Ancestries-by-County.svg 800 × 593; 2.5 MB
-
Clustering of North European individuals by the Structure software.png 3,544 × 2,088; 1,017 KB
-
Distribution Haplogroup I Y-DNA.svg 10,495 × 7,945; 761 KB
-
Europe location FIN.png 1,600 × 1,200; 712 KB
-
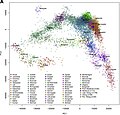
European genetic structure (based on SNPs) PC analysis.png 2,067 × 1,552; 1.12 MB
-
F2 variant sharing across 1000 Genomes individuals.png 1,163 × 1,120; 1.21 MB
-
Fenno-Ugrian people.png 1,041 × 827; 277 KB
-
Figure 2a (Cropped) PCA of Europeans.jpg 337 × 356; 19 KB
-
Finland (orthographic projection).svg 553 × 553; 353 KB
-
Finnische Frauen EM-Platzierungen.PNG 1,200 × 1,000; 68 KB
-
Finnish ancestry by country.png 1,357 × 617; 36 KB
-
Genetic distances Eurasian West Asian East Asian.png 1,063 × 1,772; 1.64 MB
-
Genetic heterogeneity in Europe.png 638 × 345; 16 KB
-
Genetic PCA of European countries 2022.jpg 4,189 × 3,184; 4.15 MB
-
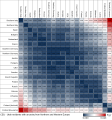
Heat map of pair-wise Fst between European populations.svg 985 × 1,051; 601 KB
-
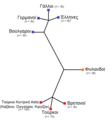
Neigbour-joining-tree-of-population-genetic-gr.png 581 × 624; 19 KB
-
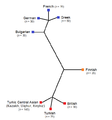
Neigbour-joining-tree-of-population-genetic.png 581 × 624; 12 KB
-
Pairwise FST values among 1000 Genomes Project and GME populations.svg 767 × 767; 284 KB
-
PCA analysis of several European populations.jpg 685 × 712; 62 KB
-
PCA and genetic distances of Uralic-speaking populations.png 1,957 × 2,478; 1.49 MB
-
PCA map of ancient and modern populations.jpg 1,822 × 1,725; 403 KB
-
PCA of 2305 Estonian samples.webp 1,804 × 735; 112 KB
-
PCA of Canary Islanders.png 950 × 993; 461 KB
-
PCA of Italians and European and Mediterranean populations.png 2,008 × 3,937; 1.09 MB
-
PCA of Sweden and Finland.png 8,040 × 4,959; 3.97 MB
-
PCA of the Belgians within European populations.png 1,349 × 961; 131 KB
-
PCA of the South-West Eurasian populations.png 915 × 928; 121 KB
-
PCA plot of European individuals.png 853 × 595; 63 KB
-
PLOS 3.PNG 2,250 × 1,839; 1.33 MB
-
QpAdm-model for selected Eurasian populations.jpg 653 × 399; 71 KB
-
Suomen geneettinen hienorakenne ennen 1950-lukua.JPG 979 × 801; 227 KB
-
Uralic populations PCA (Cropped).jpg 1,158 × 936; 185 KB


