Category:GDP maps of Europe
Jump to navigation
Jump to search
Subcategories
This category has the following 2 subcategories, out of 2 total.
E
U
Media in category "GDP maps of Europe"
The following 38 files are in this category, out of 38 total.
-
Capital regions in Europe by GDP(nominal) in 2017.jpg 2,360 × 2,140; 202 KB
-
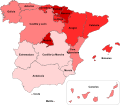
Comunidades autónomas de España por PIB.svg 707 × 618; 472 KB
-
EU GDP 2007.png 1,236 × 1,245; 56 KB
-
EU Growth.jpg 1,782 × 1,942; 1.2 MB
-
EU GRP per capita map.png 6,000 × 4,650; 1.3 MB
-
Europareizen3.png 1,068 × 692; 198 KB
-
Europe GDP 2007.png 751 × 840; 400 KB
-
Europe gdp map.png 341 × 179; 7 KB
-
Europe GDP Map.png 3,122 × 2,451; 667 KB
-
Europe GDP per capital map.png 3,122 × 2,451; 806 KB
-
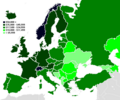
Europe-GDP-PPP-per-capita-map-corrected.png 451 × 361; 169 KB
-
Europe-GDP-PPP-per-capita-map-worldbank.png 720 × 600; 92 KB
-
Europe-GDP-PPP-per-capita-map.png 2,560 × 1,957; 568 KB
-
Europe-real-GDP-growth-2015.svg 733 × 524; 308 KB
-
European countries as US states by GDP PPP per capita, 2018.jpg 3,683 × 2,850; 1.46 MB
-
European countries by GDP nominal (2020).svg 680 × 520; 622 KB
-
European countries by GDP nominal (2022).png 1,024 × 783; 249 KB
-
European countries by GDP nominal per capita (2020).svg 680 × 520; 642 KB
-
European countries by GDP nominal per capita (2021).svg 680 × 520; 642 KB
-
European countries by GDP.PNG 2,560 × 1,958; 779 KB
-
European countries by share of total Europe's Nominal GDP.jpg 3,557 × 2,476; 2.02 MB
-
European countries with economy smaller than Baltic States.png 4,592 × 3,196; 1.13 MB
-
European gdp growth.png 341 × 179; 7 KB
-
GDP (PPP) Europe 2017-2018.jpg 451 × 346; 26 KB
-
Greek Macedonia GDP per capita.svg 3,258 × 2,519; 427 KB
-
Map of European countries by GDP (PPP) per capita in 2023.png 3,220 × 2,622; 872 KB
-
Map of European countries by GDP (PPP) per capita in 2024.png 471 × 341; 81 KB
-
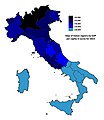
Map of Italian regions by GDP per capita in euros (2015).jpg 2,000 × 2,313; 799 KB
-
MapChart Map (5).png 4,592 × 3,196; 1.17 MB
-
Nominal GDP per capita, 2015 Eurostat France.png 4,465 × 3,450; 683 KB
-
Nominal GDP per capita, 2015 Eurostat.png 4,235 × 4,505; 1.08 MB
-
NUTS-3 regions in EU with GDP per capita over 100,000 EUR.png 3,607 × 3,875; 2.27 MB
-
Percentage of GDP spent on education in 2020.png 1,414 × 1,546; 1,023 KB
-
Pib par habitant europe.png 2,100 × 1,524; 1.13 MB
-
PIB par habitant Italie 2004.jpg 454 × 585; 124 KB
-
Romania - Nominal GDP per Capita by County.png 1,777 × 1,269; 422 KB
-
Sweden GRP per Capita (2014).png 3,528 × 7,872; 376 KB


